Curated OER
JFK Assassination
Students write equations of a line. In this algebra lesson, students investigate the assassination of JFK through linear equations. They calculate the length of given line segments.
Curated OER
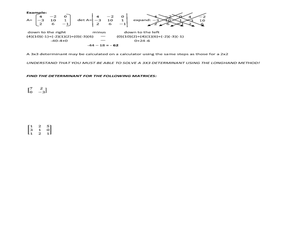
Determinants: 2x2 and 3x3 Matrices
In this Algebra II instructional activity, 11th graders find the determinant of 2x2 or 3x3 matrix and use the determinant to find the inverse of the matrix. The two page instructional activity contains explanation of topic, a...
Curated OER
Outbreak!
Eleventh graders explore the spread of a disease through a population. In this Algebra II lesson, 11th graders analyze graphical data representing they spread of a disease. Students produce a graph of the virus data,...
Curated OER
Polynomial Functions
Students explore polynomial functions. In this Algebra II lesson, students explore graphs of polynomial functions as classify the functions as linear, quadratic, cubic, or quartic. Students determine the regression equation...
Curated OER
Exact or Estimation
Students solve problems using estimation and exact calculations. In this algebra lesson, students use gum balls and thread to create hands on manipulatives to solve problems. They calculate the average of their total data.
Curated OER
Operations of Complex Numbers and Intro to DeMoivre's Theorem
Learners solve problems with complex numbers. In this algebra lesson, students factor complex numbers and simplify equations using DeMoivre's Theorem. They add, subtract, multiply and divide using negative roots.
West Contra Costa Unified School District
Solving Exponential Equations
The power to solve exponential equations lies in the resource. Scholars first learn how to solve exponential equations. An activity matching cards with equations, intermediate steps, and solutions strengthens this skill.
Curated OER
Making Money and Spreading the Flu!
Paper folding, flu spreading in a school, bacteria growth, and continuously compounded interest all provide excellent models to study exponential functions. This is a comprehensive resource that looks at many different aspects of...
Curated OER
Cartesian Coordinate System
Students research the Cartesian Coordinate System and its many uses in the world of mathematics and algebra.
Curated OER
Rational Expressions
In this Algebra II worksheet, 11th graders simplify rational algebraic expressions by factoring and cancelling the common factors. The two page worksheet contains instruction, worked examples, and three practice problems. ...
EngageNY
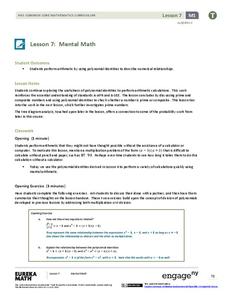
Mental Math
Faster than a speedy calculator! Show your classes how to use polynomial identities to multiply numbers quickly using mental math.
EngageNY
Bean Counting
Why do I have to do bean counting if I'm not going to become an accountant? The 24th installment of a 35-part module has the class conducting experiments using beans to collect data. Learners use exponential functions to model this...
Shmoop
Box, Stem-Leaf, and Histogram
A helpful and versatile instructional activity requires young mathematicians to analyze data in order to create graphs and answer questions. Additionally, it prompts learners to find the mean, median, mode, and range of some of...
Curated OER
Interpreting Graphs
Sixth graders interpret linear and nonlinear graphs. They create graphs based on a problem set. Next, they represent quantitive relationships on a graph and write a story related to graphing.
Curated OER
Play It
There are a number of activities here that look at representing data in different ways. One activity, has young data analysts conduct a class survey regarding a new radio station, summarize a data set, and use central tendencies to...
Curated OER
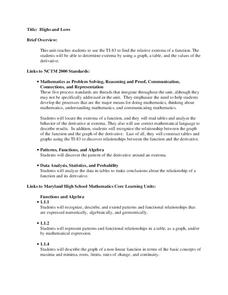
Highs and Lows
Solve problems using integration and derivatives. By using calculus, learners will analyze graphs to find the extrema and change in behavior. They then will identify the end behavior using the derivatives. Activities and handouts are...
Curated OER
A Picture is Worth a Thousand Words
In this thousands word problems worksheet, 7th graders solve and complete 6 different word problems that include the thousands place. First, they read each story and draw a picture to determine the solutions to each problem. Then,...
Curated OER
Lines, Rays, Line Segments, and Planes
Students are introduced to lines, rays, line segments and planes and study the differences between them. They also practice graphing lines, rays, line segments and planes
Curated OER
Designing Models to Simulate Actual Events Using a Random Number Generator
Students design models to simulate actual events using a random number generator on a calculator. They estimate the likelihood of a particular outcome using results of simulations. Answer Key included.
Curated OER
Making Informed Decisions Using Measures of Central Tendency
Students calculate the mean, median, mode, range, and interquartile range for a set of data. They create a box and whisker plot using paper and pencil and technology and determine which measure of central tendency is the most helpful in...
Curated OER
Introduction to Measures of Central Tendency and Variability
Students calculate the mean, median, mode, range, and interquartile range for a set of data. They create a box and whisker plot using paper, pencil and technology.
Curated OER
SOL Review
In this SOL worksheet, students solve inequalities, identify equivalent fractions and graph polynomial functions. They find the geometric means and compute average rates. This eight-page worksheet contains 20 multiple-choice...
Curated OER
Lines of Best Fit
Students determine if there is an associationm in a scatter plot of data. They analyze data through predictios, comparisons, and applications. Students calculate the line of best fit using a graphing calculator. They display data in...
Curated OER
Line of Best Fit
Young scholars identify the line of best fit. In this statistics lesson plan, students collect and analyze data. They calculate the regression equations and identify the different types of correlation.


