Curated OER
Hurricane Influence: Landfall Probabilities and Wind Speed
In this earth science worksheet, students study a hurricane map and answer 7 multiple choice question about it. They calculate the wind speed on different areas of the map.
Curated OER
Mean and Median
Students identify the different central tendencies. In this probability lesson, students create the correct type of graphs to analyze their data. They make predictions and draw conclusions from their data.
Science 4 Inquiry
Monster Mash-Up of Genetics
It's alive! Young mad scientists create monsters as they explore the probabilities of genetic traits during a well-structured inquiry lesson. Pairs travel from station to station, rolling the dice and adding traits to their creations as...
Rice University
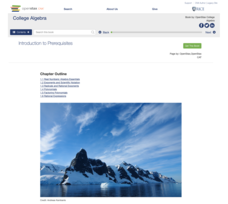
College Algebra
Is there more to college algebra than this? Even though the eBook is designed for a college algebra course, there are several topics that align to Algebra II or Pre-calculus courses. Topics begin with linear equation and inequalities,...
Rice University
Algebra and Trigonometry
Move on into trigonometry. An informative eBook takes the content of a College Algebra course and adds more relating to trigonometry and trigonometric functions. The content organization allows pupils to build upon their learning by...
Curated OER
Making Money and Spreading the Flu!
Paper folding, flu spreading in a school, bacteria growth, and continuously compounded interest all provide excellent models to study exponential functions. This is a comprehensive resource that looks at many different aspects of...
Education World
High, Low, or In Between?
Trios play a card game that reinforces the concepts of number sequence and greater than and less than. Scholars make predictions based on information they know and a single unknown. They see cards drawn by others in the group, but not...
Curated OER
Height versus Shoe Size
Middle schoolers find a correlation between a person's height and his/her shoe size. They have access to entering data into lists on a graphing calculator and can complete scatter plots. Students read and interpret a scatter plot and use...
Curated OER
China's Population Growth
Learners collect data from China's population growth and determine the mean, median, and mode from the data. In this data lesson plan, pupils determine probabilities and use them to make predictions.
Curated OER
Lewis and Clark: Equipping the Expedition
Students examine the preparations made by Lewis and Clark before leaving on their expedition. They make predictions about what they believe the two explorers took and organize the list into a venn diagram. They compare their predictions...
Curated OER
Multiple Viewpoints (Three Little Pigs)
Your youngsters have probably read The Three Little Pigs, but have they read The Three Little Wolves and the Big Bad Pig? Have your learners brainstorm how the second book could be similar or different from the first....
Curated OER
Lines of Best Fit
Students explore the concept of line of best fit. In this line of best fit lesson, students find lines of best fit in examples about riding your bike home from school and dentistry. Students find two data points and find the line of best...
Curated OER
Lines of Best Fit
Students determine if there is an associationm in a scatter plot of data. They analyze data through predictios, comparisons, and applications. Students calculate the line of best fit using a graphing calculator. They display data in...
Curated OER
Probability Distributions
Students collect and plot data on a graph. For this statistics lesson, students analyze the distribution of a sample and predict the outcome. They find the line of best fit and discuss what would make the sample larger.
Curated OER
Drawing Bugs Game
Second graders explore probability by playing a drawing game with dice. After they roll a die, they draw a tree diagram to illustrate each of the possible outcomes.
Curated OER
Another Dartboard
Fifth graders solve a word problem that involves predicting probabilities of an event and making deductions from probabilities. They discuss dice and coins and the probability of rolling each number or face of the coin, and in small...
Curated OER
The Game of Chance
Third graders use manipulatives to determine the probability of outcomes. In this probability lesson plan, 3rd graders roll dice and use spinners to determine the probability of outcomes. They determine if games are fair/unfair based on...
Curated OER
Lucky 7s
This helpful lesson explores the probability in tossing a coin and throwing dice. Specifically, it looks at the probability of getting numbers that are significant to the game of craps, assuming that once the math is understood, most...
Howard Hughes Medical Institute
The Teosinte Hypothesis
Don't want to sound corny, but your class will be a-maize-d by an engaging activity! Explore the history of the modern corn plant through a video and Punnett squares. Junior genetics experts get hands-on experience with actual research...
Curated OER
Drive the Data Derby
Three days of race car design and driving through the classroom while guessing probability could be a third graders dream. Learn to record car speed, distances traveled, and statistics by using calculation ranges using the mean, median,...
David Pleacher
Candy Math Fun
Few things can motivate children to learn like the promise of a sweet and tasty treat. Given a bag of M&M®s, Skittles®, or other colorful candy, students first predict the contents of the bag before counting the pieces,...
Curated OER
Marble Mania
Students explore the concept of probability. In this probability lesson, students develop an understanding of probability by pulling marbles out of a bag and recording the data. Students use the recording sheet to discuss the results of...
Curated OER
Using the Landscape Picture Map to Develop Social Studies Skills
Enhance your class' geography skills using this resource. Explore a variety of concepts including production and distribution, and people and the environment. Learners make predictions and identify locations on maps. This is a creative...
Albert Shanker Institute
Economic Causes of the March on Washington
Money can't buy happiness, but it can put food on the table and pay the bills. The first of a five-lesson unit teaches pupils about the unemployment rate in 1963 and its relationship with the March on Washington. They learn how to create...


