Curated OER
Spiders - KidPix
Students answer questions after a story is read aloud, identify and recall the three major body parts of a spider (head, body and 8 legs), construct a spider when given parts of a spider on a handout, and draw and decorate a spider using...
Curated OER
Rainbow Fish Graphing
Students graph different colors of rainbow fish scales after participating in a shared reading of The Rainbow Fish. They answer questions based on the graph. They practice making graphs independently using colored cereal circles.
Curated OER
Cooperative Problem Solving Tasks
Fourth graders explore the following activities where kids are encourage to think creatively, share thoughts and opinions, create, discuss and solve problems, and than draw conclusions.
Curated OER
Hop To It!
Learners explore the aspects of a frog's anatomy that allow it to be such a good jumper and jump and record the length of each jump to determine which style of jumping allows them to jump the farthest.
Curated OER
What's For Lunch? A Combination Sensation!
Young scholars combine different foods to make possible lunches and determine the specific combinations of lunches that can be made from a finite set of foods.
Curated OER
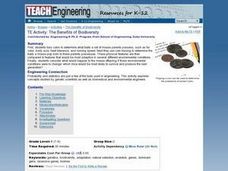
The Benefits of Biodiversity
Students examine the concept of biodiversity. They toss coins to determine what traits mouse parents have and the babies traits as well. They predict what would happen to the baby mice if the traits of the parents were different.
Curated OER
Investigating Median, Mode, and Mean
Middle schoolers develop strategies to organize data while following teacher demonstration. They calculate the mean, median and mode of a data set while determining the relationships between the numbers. They analyze data from tables and...
Curated OER
Grade 5: Alphabet Frequency
Fifth graders collect and organize data from writing samples, use fractions and decimals to describe the experimental data, and use the experimental results to make predictions about the frequency of letter usage in the English language.
Curated OER
Divide and Conquer
Seventh graders analyze responses to different types of problems. Using pictures and diagrams, they explore and model the division of fractions. Students examine situations that call for division whether with the whole numbers or with...
Curated OER
Money Circulation: A Story of Trade and Commerce
Students are introduced to the meaning, symbolism, and value of the quarter. They determine the percentage of total monetary value held in quarters and graph the results. Students infer about the U.S. Mint's distrubution of coins. They...
Curated OER
Knead Dough?
Students make bread and understand that bread gives us energy. In this bread lesson plan, students read the story A Trip to the Market, and learn about the importance of bread. Then they make the bread!
Curated OER
Play It
There are a number of activities here that look at representing data in different ways. One activity, has young data analysts conduct a class survey regarding a new radio station, summarize a data set, and use central tendencies to...
Curated OER
Modern Physics, New Phenomena
In this physics worksheet, students examine some of the historical theories of physics through the completion of 11 questions.
Albert Shanker Institute
Economic Causes of the March on Washington
Money can't buy happiness, but it can put food on the table and pay the bills. The first of a five-lesson unit teaches pupils about the unemployment rate in 1963 and its relationship with the March on Washington. They learn how to create...
Curated OER
What's Your Average? What Do You Mean? I'm More Than Just Average
Upper grade and middle schoolers collect data, analyze and interpret the data. This three-part activity should provide learners with a firm understanding about the differences between mean, median, and mode and how to perform the...
Curated OER
Political Polls
Students explore politcical polling by conducting a poll of student body elections. They prepare a survey, distribute forms, and tabulate data.
Curated OER
How Alike Are We?
Fourth graders find the range, mode, median, and mean for each of the data sets (height and shoe size). They discuss which measure of central tendency for each data set best represents the class and why. Students graph the shoe size and...
Curated OER
Matrices: A Secret Weapon
Students perform operations with matrices. In this algebra instructional activity, students use cryptography and cryptanalysis to solve problems. They add, subtract, and multiply matrices.
Curated OER
Leaf Weight-Loss Plan
Students measure the weight of a container of leaves daily to discover how quickly it grows lighter as the foliage dries.
Curated OER
Antacid Tablet Race
Students complete experiments to determine how rocket fuel is affected by surface area and temperature. They compare the reaction rates of antacid tablets. They discuss their results to complete the lesson.
Curated OER
Box Plots
Young statisticians are introduced to box plots and quartiles. They use an activity and discussion with supplemental exercises to help them explore how data can be graphically represented.
Curated OER
Mean Absolute Deviation in Dot Plots
The lesson focuses on the ideas of dot plot representations and the mean absolute deviation of data sets.
Curated OER
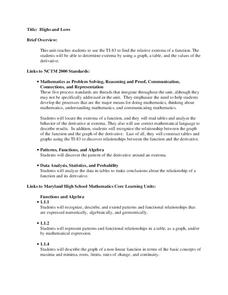
Highs and Lows
Solve problems using integration and derivatives. By using calculus, learners will analyze graphs to find the extrema and change in behavior. They then will identify the end behavior using the derivatives. Activities and handouts are...
Curated OER
Odd and Even
Explore the concept of odd and even with your class using this resource. Learners take an online test demonstrating their knowledge of odd and even, sing a song about the concept, and engage in computer-based activities.


