EduGAINs
Data Management
Using a carousel activity, class members gain an understanding of the idea of inferences by using pictures then connecting them to mathematics. Groups discuss their individual problems prior to sharing them with the entire class. The...
Curated OER
Fun Creative Activities that Teach Math
Students have fun with math. In this math skills lesson plan, students collaborate to solve the problems presented in this interactive lesson plan. The problems pertain to geometry, measurement, probability, number sense, and algebra.
Curated OER
Code Breakers
Students collect data and make a frequency table, change ratios into percents, and analyze data to make predictions.
Curated OER
The Car Pool is Coming
Students evaluate the number of people who travel out of their town to work. They figure out what the percentage of each town's commuting workers is to the number who commute in the region. They plot the percentages on a pie chart.
Curated OER
Sampling
In this statistics and probability worksheet, students solve problems that involve various sampling methods and procedures. A calculator that generates random digits is required. The five page worksheet contains eight questions. ...
Curated OER
The Elvis Password Problem
For this statistics and probability worksheet, students determine how many eight-letter passwords can be made that contain the name ELVIS. The one page worksheet contains one problem. The solution is provided.
Curated OER
Analyzing Graphs
For this statistics and probability worksheet, students analyze frequency distribution tables or histograms and box and whisker plots. The two page worksheet contains four multiple choice questions. Answers are included.
Curated OER
Mathematics Lesson for Grade 12
Twelfth graders examine multiple aspects of statistics. For this mathematical reasoning lesson, 12th graders solve problems on probability, logarithms, exponential relationships and transforming rectilinear shapes. This resource contains...
Curated OER
Math Applications
For this math applications worksheet, students solve one word problem that has two parts to it. First, they determine the expected value of a ticket for a prize. Then, student determine the fair price for the ticket purchased and explain...
Curated OER
A Statistical Study on the Letters of the Alphabet
Students use a book or magazine to research the use of letters. They complete a worksheet and compare their results.
Curated OER
"M&Ms"® Candies Worksheet 1
In this math worksheet, students find the likelihood of different outcomes with the use of M and M's candy for the seven questions and fill in the graphic organizer.
Curated OER
Possible Outcomes 6
In this math worksheet, 6th graders make predictions of the possible outcomes using the data taken from two word problems. The answers are chosen from the outcomes that are possible using the multiple choice format.
Curated OER
Coyote Cafe
In this math worksheet, students read the word problems and write down the possibilities of possible servings. The outcomes are plotted using a graphic organizer.
Curated OER
Kansas Foods A Data and Probability Investigation
Students study a number of food products and anticipate which are derived from Kansas crops. They make a list of words associated with the food stuffs and graph the results.
Pennsylvania Department of Education
Equally Likely and Unequally Likely Outcomes
Students explore probability. In this statistics/probability lesson, students compare experimental and theoretical probability and use experimental probability to make predictions and conjectures. Students explore the distinction...
Curated OER
What are the Odds
Young scholars predict the-outcome of an event. In this algebra lesson, students compare and contrast the probability of an event occurring. They calculate the odds of a simple event and make estimation.
Curated OER
Hare and Tortoise Game
Students participate in the Hare and Tortoise Game and the "Castle Warwick" problem (from an Addison Wesley text). They use the computer to practice resampling statistics and explore different approaches to their tasks. They present th
Curated OER
Fair Games
Fifth graders examine the statistics of playing games. Many games of chance and activities in maths text books involve rolling two dice and combining the scores, usually by addition. Students often find the probabilities of such events...
Curated OER
Box Plots on the TI-83 Calculator
Eighth graders research box plots on the Internet. They gather real life statistics and analyze the collected statistics by making multiple box plots on the TI-83 calculator.
Curated OER
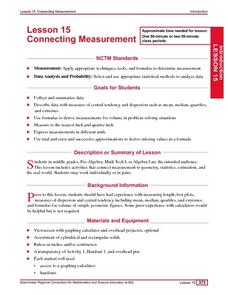
Connecting Measurement
Students participate in activities the connect measurement to geometry, statistics, estimation, and the real world. They collect measurements from their elbow to the tip of their middle finger and make a box plot of the data as well as...
Curated OER
Mean, Standarad Deviations, and Variances
In this Statistics worksheet, 11th graders compute the mean, standard deviation and variances for four different problem scenarios. The one page worksheet contains four scenarios, each with eight questions. Answers are provided.
Curated OER
Opinion Surveys
Students examine the factors that affect the accuracy of opinion surveys. They calculate probability and chance using data they have collected. They practice reading tables and graphs as well.
Curated OER
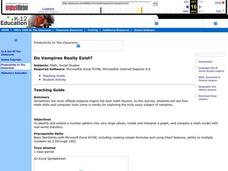
Do Vampires Really Exist?
Learners identify and extend a number pattern into very large values. They create and interpret a graph based on their number patterns. Students compare a math model with real-world statistics about the existence of vampires.
Curated OER
Health In Progress/ Soft Drinks
Students engage in a lesson that is concerned with the consumption of soft drinks by children. They examine the statistics about the consumption and determine the increase or decrease in individual servings consumed over time. They...


