Curated OER
And Around We Go!
Sixth graders conduct a survey and collect data to construct a bar graph that will then be changed into a circle graph. With the bar graph, 6th graders compare estimated fractions and percentages and estimate percentages. With the circle...
Curated OER
Caloric Expenditure in Powwow Dancing
Sixth graders investigate the meaning of different types of Native American music and dance. They determine how this music and dance has contributed to modern music and dance. They problem solve to determine the average length of the...
Curated OER
Modeling Population Growth
Learners investigate the reasons for taking a census and determine the problems that are involved in the process. They examine the population figure for Montana and Lake county before using the information to complete the included...
Curated OER
A Pocketful of Change
Students study the meaning, symbolism, and value of U.S. coins,
especially the quarter. They conduct a survey of coins in students'
possession, graphing the results to show frequency distribution and drawing
inferences about the U.S....
Curated OER
Graphosaurus
Students complete bar graphing activities with a dinosaur theme. Students discuss their favorite dinosaurs, collect data about the discussion, and make a floor graph of the information. Students complete a dinosaur graph worksheet.
Curated OER
Fractals and the Chaos Game
Students explore the concept of fractals. In this fractals lesson, students play the "Chaos Game" via an applet. Students place dots on the screen to recognize that they have created Sierpinski's Triangle.
Curated OER
Using Computers to Produce Spreadsheets and Bar Graphs
Students review graphing terminology and how to plot data points, how to input data into a spreadsheet, and how to make a chart using a computer.
Curated OER
Line graphs
In this line graphs worksheet, students read 2 line graphs and answer short answer questions about them. Students answer 5 questions for each graph.
Curated OER
Shake, Rattle & Roll
Students examine soil. For this science lesson, students examine the layers of soil. Students collect soil from various locations and separate the layers. Students record and chart their findings.
Curated OER
Binomial Distribution
Students explore the concept of binomial distribution. In this binomial distribution instructional activity, students perform binomial distributions on a number of problems in this lecture instructional activity. Students find the mean...
Curated OER
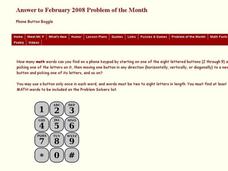
Phone Button Boggle
In this phone button boggle worksheet, students identify the number of math words they can find on a phone keypad according to given directions. This one-page worksheet contains one problem. Answers are provided.
Curated OER
Finding Mean, Mode and Median in the Computer Lab
Students create spreadsheets which will display and figure mean, median, and mode of a set of numbers.
Curated OER
Figuring Elapsed Time
Students discover the concept of elapsed time. In this calculating time lesson, students utilize the Internet to complete record sheets based on the concept of elapsed time. Finally, the students answer questions on their own.
Curated OER
Where in the World is Utah Wheat?
Students examine the role of climate and landforms in the use of Utah's land. In this geography lesson, students analyze the relationship between geography and agriculture in the state as they examine data regarding wheat production in...
Curated OER
Sampling Snoops
Students practice formulating a hypothesis and designing an experiment to test the hypothesis. They identify several sampling techniques they can use to test their hypotheses.
Curated OER
Scale Me Down
Students create scale drawings, and ultimately scale models, of real-world objects in this Math lesson about ratios, proportion, scaling factors, and cross products. The lesson includes ideas for cross-curricular extensions and is...
Curated OER
M&M Caper
Students participate in a game with M&M's to be introduced to percents and ratios. Individually, they estimate and record the number of candies they believe the bag holds and the amount of each colored candy. They open the bag and...
Curated OER
Stem-and- Leaf Plots
Students are introduce to the notion of stem-and-leaf plots. They use stem-and-leaf plots to calculate the mean, median, and mode of a set of data. Students use computers to learn about stem-and-leaf plots.
Curated OER
Tracking the Wild Ones
Students apply mathematic skills to discover the extent of the concern for endangered species. Students analyze graphs and look for trends in graphed results of endangered species on a global level.
Curated OER
A Fortnight of Furlongs
Young scholars perform a webquest to research information about the horse industry. They look at economic and the cultural impact of the industry on Central Kentucky and then create a group presentation that addresses all essential...
Curated OER
The Estimation Station
Students challenge "common knowledge" against newly learned estimation strategies and put those strategies into use. They consider variables in estimating different groups of objects and practice skills of representing numbers.
Curated OER
RISKY BUSINESS--OR NOT!
Students learn about the importance and risk that stocks carry within a business. In this financial management lesson, students use role play and case scenario situations to decide what stocks are best for given companies. Based on the...
Curated OER
Lines of Best Fit
Students explore the concept of line of best fit. In this line of best fit instructional activity, students find lines of best fit in examples about riding your bike home from school and dentistry. Students find two data points and find...
Curated OER
Sampling Techniques
Sixth graders examine how to select samples and apply them to an experiment. In this sampling lesson, 6th graders use a bag of yellow and blue cubes to take a sample. They predict how many of each color there are the bag. They set up and...


