Texas Instruments
Texas Instruments: Weather Study With Ti Interactive
Students will extract weather data from the web for several major cities. They will then display and discuss the data.
Ministry of Education and Universities of the Region of Murcia (Spain)
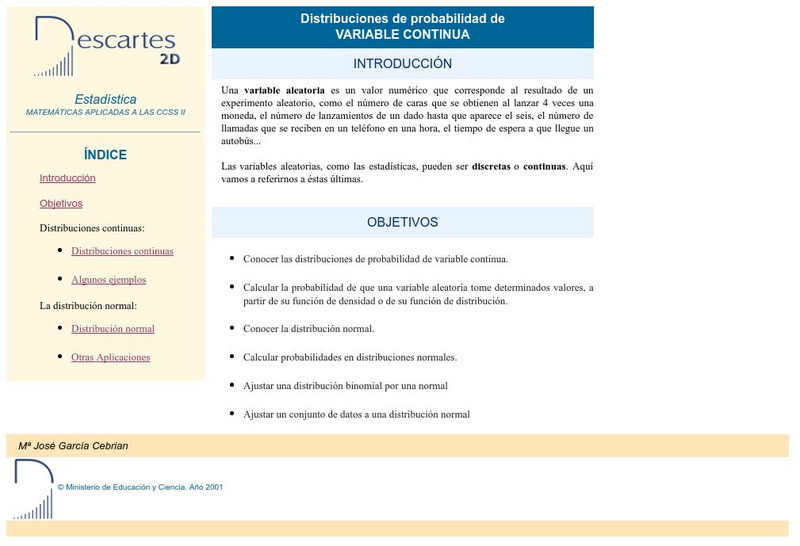
Ministerio De Educacion Y Ciencia: Distribuciones De Probabilidad
Learn about normal distribution, calculate odds on normal distributions and fit a set of data to a normal distribution.
TED Talks
Ted: Ted Ed: Hans Rosling Shows the Best Stats You've Ever Seen
Explore collected data in regards to life expectancies, family size, and finances through out the world and the various ways the data has been displayed.
Texas Instruments
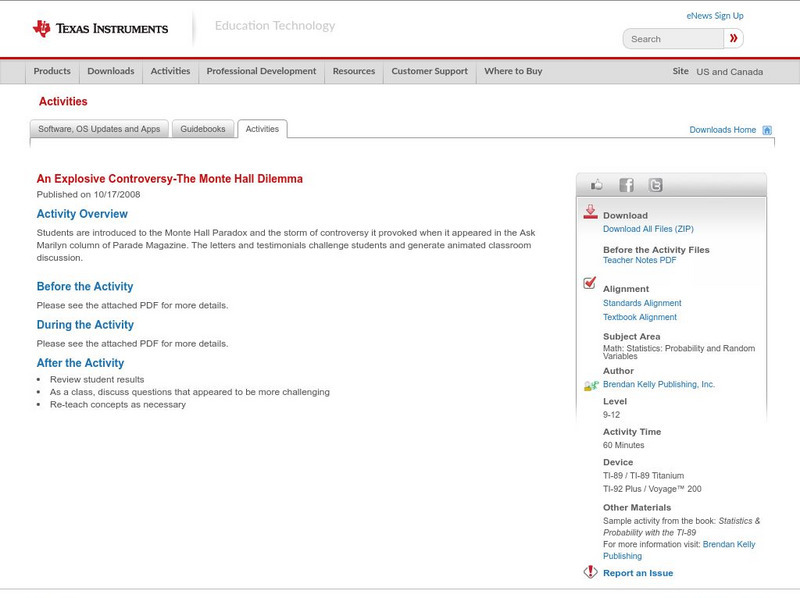
Texas Instruments: An Explosive Controversy the Monte Hall Dilemma
Students are introduced to the Monte Hall Paradox and the storm of controversy it provoked when it appeared in the Ask Marilyn column of Parade Magazine. The letters and testimonials challenge students and generate animated classroom...
Texas A&M University
Wtamu Virtual Math Lab: Beginning Algebra: Reading Graphs
A good introduction to reading bar, line, and double line graphs, and drawing and reading Venn diagrams. Contains definitions and examples of these types of charts and graphs as well as practice exercises that ask you to answer questions...
Wikimedia
Wikipedia: Matematica Discreta
In Spanish. Overview of discrete math and various related topics. Also discusses the theories and mathematicians behind finite math.
Other
Hsor.org: Miguel Chooses a College: Tradeoffs
Use several strategies and criteria to help Miguel determine the college for him.
University of Cambridge
University of Cambridge: Maths and Sports: The Home Advantage
In the 2008 Beijing Olympics the UK finished 4th in the total medal count. How might we do in 2012, and does the country hosting the Olympics have an edge?
CK-12 Foundation
Ck 12: Algebra: Fitting Lines to Data
[Free Registration/Login may be required to access all resource tools.] Make a scatter plot of data and find the line of best fit to represent that data.
Sophia Learning
Sophia: Continuous Data Tutorial
Continuous data is defined and explained in this video.
Sophia Learning
Sophia: Continuous Data
Continuous data is defined and examples are given in this lesson.
Sophia Learning
Sophia: Continuous vs Discrete Data
Explore continuous and discrete data and when to use one over the other.
Sophia Learning
Sophia: Continuous vs Discrete Data
Explore continuous and discrete data and determine when to use each one.
Sophia Learning
Sophia: Discrete Data
Explore the term discrete data and look at examples for further explanation.
Sophia Learning
Sophia: Practical Applications of the Bell Shaped Curve
Explore the bell-shaped curve and how to calculate a z score. Additional links provided to further knowledge on outliers.
University of Cambridge
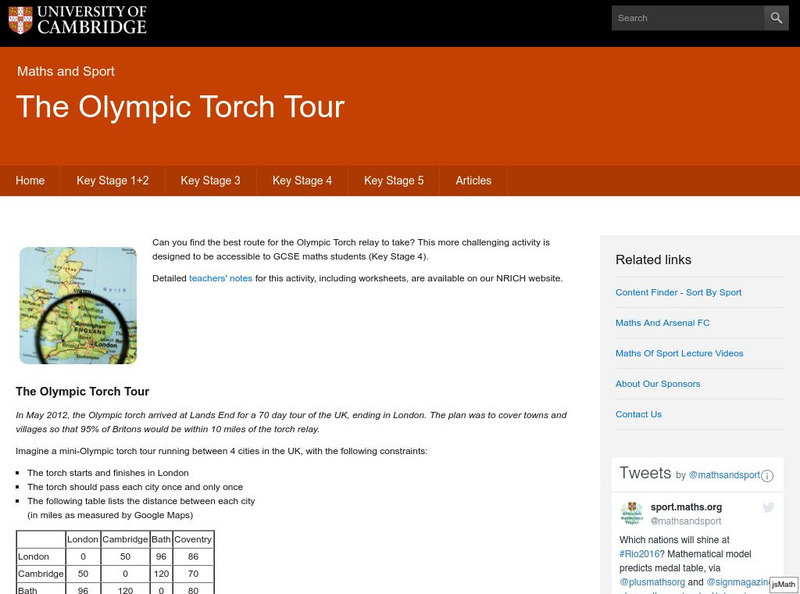
University of Cambridge: Maths and Sports: The Olympic Torch Tour
Can you find the best route for the Olympic Torch relay to take? This more challenging activity is designed to be accessible to GCSE maths students (grades 8, 9, and 10).


