Curated OER
Spinners and Fractions
Your learners create their own spinner using different colors and analyze the likelihood of landing on certain colors. The solutions are presented as fractions.
Concord Consortium
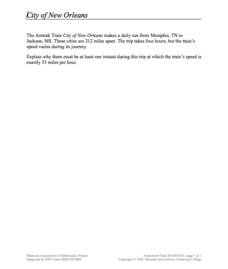
City of New Orleans
In the United States, most trains operate at a top speed of 100 miles per hour. Scholars use information on the distance and time of a train trip to determine if the train ever reaches a specific speed. They connect pieces of information...
Curated OER
Significant What?
Students define accuracy and precision, and differentiate between the two terms, apply the concepts of accuracy and precision to a given situation and correctly apply the concept of significant figures to measurement and mathematical...
Curated OER
Fruit Loop Graphing
Fifth graders interpret data and create graphs. Given Fruit Loops, they sort and classify according to color. Using spreadsheet technology, 5th graders record their data and create bar and circle graphs. Students analyze data and...
Curated OER
Ashes to Ashes: Using Evaporation Rate to Identify an Unknown Liquid
Learners explore the concept of evaporation rates in this evaporation rates lesson. They will try to identify the chemical that began a fire, perform an experiment where they use the evaporation rates to determine the unknown liquid, and...
Curated OER
What Did It Cost 100 Years Ago?
Students compare prices of good across the century in order to introduce the topic of inflation. They undertand the concepts of inflation and Consumer Price Index (CPI), use online calculators to figure the approximate cost of goods...
Curated OER
The Cube and Coin Challenges
Second graders participate in several games based on colored cubes and coins. They try to figure out the relative rate at which things happen and assess the concept of playing a fair game with their peers. Each student compare familiar...
Curated OER
Predicting the Future
Students examine how scientists predict the effects of global climate change. In this environmental science lesson, students participate in a discussion about using computer generated data to create climate predictions. Students examine...
Curated OER
Principles of Flight: Where are We?
Learners explore the concept of topographical maps. In this topographical map instructional activity, students discuss how airplanes know where to fly. Learners use topographical maps to simulate a field trip on the computer.
Curated OER
Solving a Legend- Exponents, Recursive and Explicit Equations.
Eighth graders play a game to solve problems. For this exponents and scientific notations lesson, 8th graders play a game in small groups to move colored disks from location A to location C. Students identify recursive patterns to solve...
Center of Excellence for Science and Mathematics Education
A Sick Astronaut
Aspiring astronauts graph, interpret, and analyze data. They investigate the relationship between two variables in a problem situation. Using both graphic and symbolic representations they will grasp the concept of line of best fit to...
Curated OER
What Does Average Look Like?
Fifth graders explore the concepts of range, median, mode, and mean through the use of graphs drawn from models. They use manipulatives to represent data they have collected within their groups, and compare the differences between mode,...
Curated OER
Traveling Through the Solar System
Students use calculator and non-calculator methods for analyzing data. They apply data collection and analysis in a study of mass and weight. Students enhance and apply the concept of line of best fit. They master graphing in a plane,...
Curated OER
Spending Plans
Students explore the concept of dividing their money into categories, namely "save," "spend," and "share." They engage in activities that help them explain that money is limited in quantity and must be divided for different purposes.
Curated OER
Terror in Space
Students view a video clip about the role of satellites in space. They examine the concept of center of mass. They participate in an experiment showing how altering the location of an object's center of mass can change its motion.
Alabama Learning Exchange
I'm Lovin' It: Finding Area Between Curves
Students explore the concept of finding the area between two curves. For this finding the area between two curves instructional activity, students model the logos of McDonalds, Nike, and Motorola on grid paper. Students find functions to...
Alabama Learning Exchange
Technology for Displaying Trigonometric Graph Behavior: Sine and Cosine
Students explore the concept of sine and cosine. In this sine and cosine lesson, students work in groups to graph sine and cosine functions. Students examine how coefficients in various parts of each parent function shift the graph. ...
Curated OER
Bodacious Buttons
First graders participate in games, graphing, and probability exercises to sort and graph buttons. They sort buttons with Venn diagrams and Bull's Eye graphs.
Curated OER
Data Collection and Presentation
Students access how to collect, classify and display data involving statistics. The concepts of quantitative, discrete and continuous data is covered in depth within the lesson. They practice with a scenario of James filled with...
Curated OER
Is the Hudson River Too Salty to Drink?
Students explore reasons for varied salinity in bodies of water. In this geographical inquiry lesson plan, students use a variety of visual and written information including maps, data tables, and graphs, to form a hypothesis as to why...
Curated OER
Using Proportions to Estimate
Students calculate ratio and proportion. In this unit rates lesson, students estimate using proportions and find their errors in doing so. They calculate unit rates and define the concept of unit rates.
Curated OER
Data Analysis, Probability, and Discrete Math: Lesson 6
Eighth graders engage in a lesson plan that is concerned with the concepts surrounding the interpretation of information included in graphs for analysis of data for probability. They examine circle graphs and differentiate the values of...
Curated OER
Slopey Math
Young scholars identify the slope of a line and use it to solve real life problems. For this algebra lesson, students write linear equations in slope intercept form and make a correlation to its relation to the real world. They use the...
Curated OER
Math: How Many Red M&Ms?
Sixth graders calculate the mean, median, and mode of candy M&Ms and find the percentage of each color. Once they complete the assignment, they compare their results with those of the candy company's percentages. As an extension,...


