Curated OER
Histograms and Bar Graphs
Students are introduced to histograms, bar graphs, and the concept of class interval. They use an activity and three discussions with supplemental exercises to help students explore how data can be graphically represented (and...
Curated OER
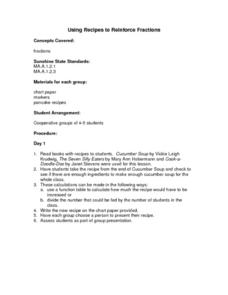
Using Recipes To Reinforce Fractions
Students calculate fractions used in various food recipes in this Math lesson with real world applications. The lesson is geared towards upper elementary students but can be adapted for various levels of learners. State math standards...
Curated OER
The Bell Curve
Pupils explore the concept of the bell curve. In this bell curve instructional activity, students discuss the controversy associated with the bell curve. Pupils use an applet to explore a normal distribution. Students discuss mean,...
Curated OER
Designing Samples/Simple Random Samples
High schoolers explore the concept of sampling techniques. In this sampling techniques lesson, students identify possible sources of bias in situations such as phone polls, supermarket surveys, and drawing names from a phone book. High...
Curated OER
Line of Best Fit
High schoolers explore the concept of linear regression. In this linear regression lesson, students do a Barbie bungee activity where they collect linear data. High schoolers plot their data using a scatter plot. Students determine a...
Curated OER
Box and Whisker Plots
Seventh graders explore the concept of box and whisker plots. In this box and whisker plots lesson, 7th graders plot data on a box and whisker plot. Students discuss the mean, median, and mode of the data. Students discuss range,...
Curated OER
Cartesian Coordinate System
Middle schoolers explore the concept of the coordinate plane. For this coordinate plane lesson, students graph points on the coordinate plane using an applet. Middle schoolers graph functions using an applet. Students play a Maze Game...
Curated OER
The Mandelbrot Set
Students explore the concept of Mandelbrot sets and Julia sets. In this Mandelbrot and Julia set instructional activity, students use a function integrator applet to investigate two-variable function iterations. Students use Julia set...
Curated OER
Scoring a Financial Education
Students explore the concept of money management. In this money management lesson, students read an article about students taking a finance course in high school and college. Students discuss the importance of money management. Students...
Curated OER
Look for Patterns: Quilts in Two Faith Ringgold Stories
Author Faith Ringgold uses quilts to illustrate her books Tar Beach and Aunt Harriet's Underground Railroad. In this integrated trio of activities, young scholars read stories, identify and create patterns, and design quilt squares of...
Curated OER
Time Zones
Students are able to read and also use a variety of timetables and charts. They perform calculations with time, including 24-hour clock times and time zones. These are very important concepts that Students probably have to bear in mind...
Curated OER
Prime Time Math
Seventh graders use educational software in order to practice lesson objectives. They define rate and ratio. Students solve distance problems given two variables. They also use a problem solving strategy that can be defended in its usage.
Curated OER
Math Can Be Mean!
Fifth graders are introduced to the topic of means. Calculating the mean, mode and median, they describe what each set of numbers tell and do not tell about the data. They use a line graph to practice finding the mean. They also use...
College Board
Power in Tests of Significance
Test your knowledge of tests of significance. A curriculum model for AP® Statistics describes and defines power in terms of tests of significance. It also provides two classroom activities designed to investigate power and how it relates...
Curated OER
The Titanic 2
Did the rescue procedures on the Titanic favor the first-class passengers? Use actual historical data to explore independent and dependent events with your class. Part of a series of worksheets, but can be used separately.
Shodor Education Foundation
Pythagorean Theorem
Most adults remember learning about the Pythagorean theorem, but they don't all remember how to use it. The emphasis here is on developing an intuitive understanding of how and when to use the theorem. Young mathematicians explore...
Curated OER
Reading Graphs
Working independently or in teams, your class practices connecting graphs, formulas and words. This lesson includes a guided discussion about distance vs. time graphs and looking at how velocity changes over time.
EngageNY
Looking More Carefully at Parallel Lines
Can you prove it? Making assumptions in geometry is commonplace. This resource requires mathematicians to prove the parallel line postulate through constructions. Learners construct parallel lines with a 180-degree rotation and then...
5280 Math
Integer Interpreter
Can you add variables if you don't know their value? Using an empty number line, scholars first locate the position of the difference, sum, product, and quotient of two unknown integers. Later problems mix operations as well as add...
Alabama Learning Exchange
Bloodstain Pattern Doesn't Lie......
An interesting instructional activity on hypothesizing about the diameter of a drop of blood that is splattered. To test their theories, learners work in groups to make blood droplets splatter from different heights. They use graphed...
Ohio Department of Education
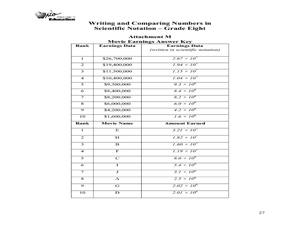
Writing and Comparing Numbers in Scientific Notation-Grade Eight
Explore scientific notation in this mathematics lesson. Young mathematicians explore multiple representations of large number in scientific notation through the use of models, visual representation and expanded form. The lesson provided...
Shodor Education Foundation
Algorithm Discovery with Venn Diagrams
Here is a lesson that takes an interesting approach to analyzing data using box and whisker plots. By using an applet that dynamically generates Venn diagrams, the class forms a strategy/algorithm for guessing the rule that fits the...
Shodor Education Foundation
InteGreat
Hands-on investigation of Riemann sums becomes possible without intensive arithmetic gymnastics with this interactive lesson plan. Learners manipulate online graphing tools to develop and test theories about right, left, and midpoint...
Radford University
A Change in the Weather
Explore the power of mathematics through this two-week statistics unit. Pupils learn about several climate-related issues and complete surveys that communicate their perceptions. They graph both univariate and bivariate data and use...


