Albert Shanker Institute
Economic Causes of the March on Washington
Money can't buy happiness, but it can put food on the table and pay the bills. The first of a five-lesson unit teaches pupils about the unemployment rate in 1963 and its relationship with the March on Washington. They learn how to create...
Curated OER
Probability
Sixth graders explore probability. They analyze a class chart and list the letters of the alphabet according to frequency. Using the data collected, they complete probability problems.
Curated OER
Exploring Probability
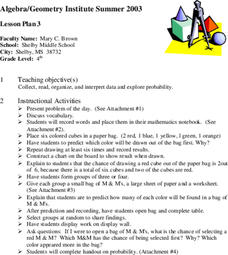
Fourth graders participate in a lesson that explores probability. They use candy and model cubes to experiment with different outcomes that can be charted if the students can proceed to the objective of the lesson. They discover how...
Curated OER
You May Already Be a Winner!
Second graders flip coins and tally the outcomes. They play the You May Already Be a Winner! game with cards under their chairs. Some cards are winners, some might be and the others are not. They play to explain the probability concept.
Curated OER
Calculating Theoretical & Experimental Probability
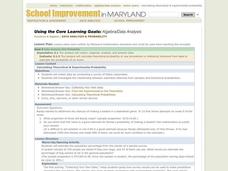
Students explore the concept of experimental and theoretical probability. In this experimental and theoretical probability lesson, students collect data by conducting a survey of their classmates. Students compare their data and discuss...
Curated OER
Probability: Playing with Fire
Students use probability to determine how likely it is for each tree in a small forest to catch on fire.
Curated OER
ng Data: Probability, What's in the bag?
Learners use the language associated with probability to discuss events including those with equally likely outcome. They collect data from a simple experiment and record in a frequency table: estimate probabilities based on this data
Curated OER
Heads-Up Probability
Second graders use tree diagrams to predict the possible outcomes of coin tosses. The data they collect and graph also help them predict the likelihood of getting heads or tails when tossing coins the next time.
Curated OER
M&M Graphing and Probability
Students create a variety of graphs. They count, sort, and classify M&M's by color and record data on a chart. They use data from the chart to create pictographs, bar graphs and circle graphs. They analyze data and determine...
Virginia Department of Education
May I Have Fries with That?
Not all pie graphs are about pies. The class conducts a survey on favorite fast food categories in a instructional activity on data representation. Pupils use the results to create a circle graph.
It's About Time
Volcanic Landforms
Did you know the word volcano comes from the name of the Roman god of fire, Vulcan? During this activity, scholars make a topographic map, interpret topographic maps, and infer how lava will flow based on their analysis.
Curated OER
Study of Chance
Seventh graders determine the fairness of various games. In this determining the fairness of various games lesson, 7th graders use spinners, dice, and rock,paper, scissors to play various chance games. Students determine if...
Curated OER
Graphing Activity
In this probability and statistics worksheet, learners work with a family member to construct graphs based on real life data. The two page worksheet contains three questions. Answers are not included.
Curated OER
Flip a Coin
Students are introduced to the concept of probability. In groups, they make a prediction about how many times a coin might show heads or tails when flipped. They carry out the experiment and record their results to compare it to their...
Curated OER
Coin Drop
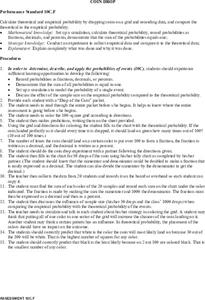
Students calculate the theoretical and empirical probability by dropping coins on a grid. They record their data and compare the theoretical and empirical data. Students make predictions about the results before conducting the experiment.
Curated OER
Escape The Hangman
Seventh graders investigate the concept of probability. They use the game of hangman to create engagement and context for conducting the lesson. They create a spreadsheet with data that is given. Students make predictions based on data.
Curated OER
Efficiency Means Getting More for Less
Learners measure water and make predictions about efficiency.
Curated OER
Creating a Thematic Map Using S'COOL Data
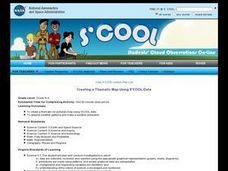
Learners observe weather patterns, collect data, and make a weather predictions for various locations on a map.
Curated OER
Hi, Deer!
Students collect, organize by table, and examine census data in a simulation, estimate the size of the population in the simulation and make predictions based on the collection of census simulation data.
Curated OER
Parachute Drop
Students explore the effects of gravity. They create a parachute and make predictions about the effect of adding weight to the bottom of the parachute. Students record and interpret results of parachute experiments.
Curated OER
Pika Chew
Students work in collaborative teams with specific roles, use the Internet to research the behavior and ecology of pikas, make predictions about survival rates of pikas in different habitats and organize their data in graphs.
Curated OER
Lego Robotics: Measuring Speed
Students build and program a LEGO robotic car as well as measure and graph its speed. They acquire familiarity with principles of construction, motion, design and problem solving. They compare a robot's speed over two different surfaces...
Curated OER
Weather, Data, Graphs and Maps
Students collect data on the weather, graph and analyze it. In this algebra instructional activity, students interpret maps and are able to better plan their days based on the weather reading. They make predictions based on the type of...
Curated OER
What's the Chance?
Students study probability and statistics by conducting an experiment, recording their results, and sharing data with classmates.


