Pennsylvania Department of Education
Adding and Subtracting Rational Numbers to Solve Problems
Students explore the concept of probability. In this probability lesson, students use area to determine probability. Students use charts and spinners to help determine the probability of events such as flipping a coin or rolling a...
Curated OER
Probability
In this probability instructional activity, 6th graders solve and complete 3 different problems. First, they place the events on the probability scale shown. Then, students match the phrase to the best description of its chance of...
Curated OER
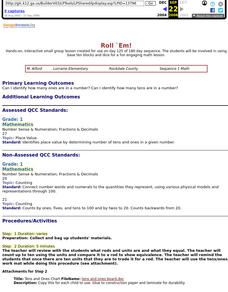
Roll `Em!
First graders engage in using base ten blocks and dice for a fun engaging math lesson. They use a worksheet imbedded in this lesson as the game board to help them play this math game.
Curated OER
Radon Alert: Understanding Odds
In this radon alert: understanding odds worksheet, 5th graders predict results of rolling dice and record data in a chart, then compare odds of events and occupations, then compare that with radon exposure.
Curated OER
Lara's Equiprobable Dice
Students try some new exercises involving probability. These are, first of all, that the probability of getting a given total when two dice are rolled is equal to the number of possible ways of getting that total, divided by 36 (the...
Curated OER
Make the Highest Total
Sixth graders predict the outcome of a simple probability experiment, test it and explain the result by using problem solving strategies to explore situations mathematically. They then play a few games informally where students play in...
Curated OER
Matching Pairs
Students examine the probability of the various findings in a game and determine the odds of winning. They differentiate between the facts of odds versus probability. Students use higher order thinking skills to explain how a problem is...
Curated OER
Coin Tossing
Sixth graders examine the use of probability and compare it to actual real world results. In groups, they flip a coin a specific number of times while their other group members roll a set of dice the same amount of times as the coin. To...
Curated OER
Linear Equations
Eighth and ninth graders solve and graph 42 different problems that include writing various equations and graphing them on a grid. First, they create a table for each equation and graph it on a grid locating the x-and y-intercepts. Then,...
PBS
Remove One
With a set of 15 chips and a number line, learners predict what sums may occur with the rolling of two dice. When their sum comes up, they remove one of the chips from their number line with the objective of being the first to remove...
Curated OER
The Apple Blossom Problem
In this apple blossom problem, students examine a given situation in a board game. They determine the best way to win the game and the expected payoff. This one-page worksheet contains 1 problem.
EngageNY
Expected Value of a Discrete Random Variable
Discover how to calculate the expected value of a random variable. In the seventh installment of a 21-part module, young mathematicians develop the formula for expected value. They connect this concept the dot product of vectors.
EngageNY
Games of Chance and Expected Value 1
There's a strong chance that class members enjoy learning math through engaging games. Scholars analyze games of chance to determine long-term behavior. They learn to calculate expected value to help with this assessment.
Curated OER
Creating a Bar Graph Using a Spreadsheet: Dice Rolling Probabilities
Tenth graders explore the concept of spreadsheets. They create a simple spreadsheet and chart from given data. Students perform basic formatting procedures on their chart. They use spreadsheet functions to perform calculations.
Curated OER
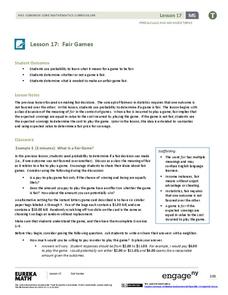
Fair Games
Fifth graders examine the statistics of playing games. Many games of chance and activities in maths text books involve rolling two dice and combining the scores, usually by addition. Students often find the probabilities of such events...
Curated OER
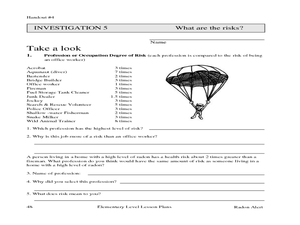
What Are the Risks?
Young scholars use dice to determine the risk of being exposed to radon. They practice using new vocabulary related to probability and ratios. They make predictions about the results and record their observations.
Curated OER
Tree Diagrams
In this tree diagram worksheet, students read story problems. From the given information, they draw tree diagrams to determine the total possible number of outcomes. This one-page worksheet contains ten problems.
Curated OER
Counting Principle
In this counting principle instructional activity, students solve 10 problems by applying the counting principle to each one. First, they determine the number of possible outcomes in a coin toss. Then, students the number of different...
Curated OER
Making Learning a Game
A game lesson can be a way to explore a variety of concepts with your students.
Curated OER
The Fair Factor
Students participate in playing many games to determine if they are fair or not. They create their own game that is fair to play with their classmates.
Curated OER
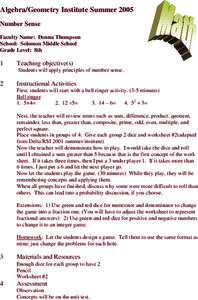
Number Sense
Eighth graders participate in a lesson that is concerned with reviewing basic math concepts using the four operations. The activity is composed of a math game that is played by them.
Illustrative Mathematics
Illustrative Mathematics: 7.sp Rolling Dice
Roll two dice 10 times. After each roll, note whether any sixes were observed and record your results in the table below. Aligns with 7.SP.C.7.
University of Texas at Austin
Mathematics Teks Toolkit: Rolling Races
Students play a game by rolling dice and determining the probability of outcomes of colors.
Beacon Learning Center
Beacon Learning Center: Lions, Tigers, and Probability
Students explore the probabilities of simple events, such as rolling a dice, in this interactive web lesson.


