Curated OER
A Statistical Study on the Letters of the Alphabet
Students see that there are mathematical rules that can affect our use of the English language. Calculate the probability of picking any letter at random from a piece of English literature.
Curated OER
Probability: Playing with Fire
Students use probability to determine how likely it is for each tree in a small forest to catch on fire.
Curated OER
Sampling Distribution and Estimators Section 6.4
In this distribution worksheet, students examine given situations, determine the probability of an event, identify the standard deviation, and find a specified percentile and quartiles. Five probability story problems are available on...
Curated OER
Probability
In this math literacy worksheet, students solve the four problems related to the concept of probability using the multiple choice format.
Curated OER
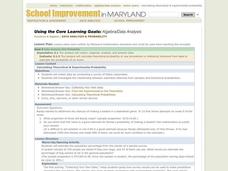
Calculating Theoretical & Experimental Probability
High schoolers explore the concept of experimental and theoretical probability. In this experimental and theoretical probability lesson, students collect data by conducting a survey of their classmates. High schoolers compare their data...
Curated OER
Statistics and Shopping
Students examine statistics and data analysis concepts from the practical questions that arise in everyday life.
Curated OER
Rolling For Value
Young scholars participate in a lesson to comprehend the concept of probability while rolling dice. They recognize patterns while making observations and recording the data for each roll. Students also review place values while playing a...
Curated OER
Descriptive Statistics
Students demonstrate how to use frequency and scatter diagrams. In this statistics lesson plan, students are introduced to different techniques of representing data. Students sort and graph data on a worksheet and use a frequency diagram...
Curated OER
Make That Shot!
Students figure out basic percentages by shooting paper balls into a basket, recording results, and calculating individual and team percentages for ten shots.
Curated OER
Cyber Chow Combos
Students, after watching the CYBERCHASE episode, "A Day at the Spa,"represent and count combinations of choices using tree diagrams.
Project Maths
Outcomes of Coin Tosses
Flip a coin: heads, use the resource; tails, use the resource. The fourth of six installments of the Statistics & Probability unit looks at coin tosses and probability. The class conducts an experiment and sees that the outcomes of...
Curated OER
Starting With Stats
Statisticians analyze a data set of student IQs by finding measures of central tendency and dispersion such as mean, median, mode, and quartiles. They practice using a graphing calculator to find the values and analyze box plots and...
Illustrative Mathematics
Accuracy of Carbon 14 Dating II
The scientific issue of carbon-14 dating and exponential decay gets a statistics-based treatment in this problem. The class starts with a basic investigation of carbon content, but then branches out to questions of accuracy and ranges of...
Curated OER
Mathematics: A Picture's Worth a Thousand Words
Students examine school yearbooks from 1950 to the present. They count the number of male and female teachers and administrators. They compile date and extrapolate changes in job trends.
Curated OER
Musher Graphing and Probability
Students use the internet to research statistical information on the musher dogs participating in the Iditarod. Using the data, they create three different types of pie charts. They use the charts to answer questions about the dogs. They...
Curated OER
Energy Content of Foods
Learners collect data, organize and analyze the data and compare it to real life scenarios. This assignment requires two class periods.
Virginia Department of Education
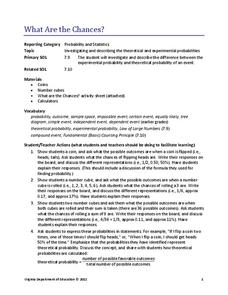
What Are the Chances?
Take a chance on an informative resource. Scholars conduct probability experiments involving coins and number cubes to generate data. Compiling class data helps connect experimental probability to theoretical probability.
Curated OER
Algebra/Geometry Institute 2007
Fifth graders practice calculating probability using statistics. In this math statistics lesson, 5th graders discover the meanings of the terms unlikely, likely, eventually, and chance, when asked to answer questions about the...
Curated OER
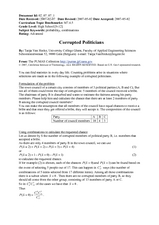
Corrupted Politicians
High schoolers solve problems using statistics and probability. In this math lesson, students analyze how many corrupted members there are in a fictional town council. They give real life examples where statistics and probability can be...
Curated OER
Why NP Min?
Students calculate the normal distribution. In this statistics lesson, students use the normal distribution to estimate binomial distributions. They define when to use NP and n(1-p) to make approximations.
Curated OER
Remote Possibilities
Students collect data and analyze the data using a graph. In this statistics lesson, students use combinations and theoretical and experimental probability to analyze their data. They observe a remote controlled robot as they collect data.
Curated OER
Misleading Graphs
Students explore number relationships by participating in a data collection activity. In this statistics instructional activity, students participate in a role-play activitiy in which they own a scrap material storefront that must...
Curated OER
Assessing Normalcy
Students define normal distribution as it relates to the bell curve. In this statistics lesson plan, students use the central tendencies of mean, median and mode to solve problems. They plot their data and draw conclusion from the graphs.
Curated OER
What is a P-value?
Learners test the hypotheses using p values. In this statistics lesson plan, students define and examine conditional probability. They test each statement for a true statement or a false statement, based on the sample size.


