Curated OER
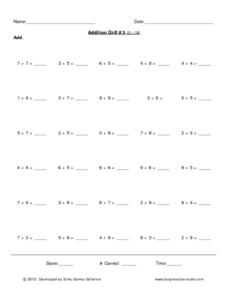
Addition Drill #3 (0-18)
In this math worksheet, 2nd graders solve 30 single-digit addition problems with sums ranging from 0 to 18. Students notate their score, # correct and time.
Curated OER
Addition Drill #3 (0-10)
In this math worksheet, 2nd graders solve 30 single-digit addition problems whose sums range from 0 to 10. Students notate their score, # correct and time.
Curated OER
How Long Does It Take?
Students investigate the lengths of time various activities take and calculate how long is spent on these activities in a week. They complete a worksheet for each activity that is timed, and calculate lengths of time for simulated...
California Education Partners
Window Washers
Aim high with a task on window washers. An assessment task challenges learners to determine the number of windows two people wash. They do this using a given number of window rows on each side of a building. In addition, they find the...
California Education Partners
Miguel's Milkshakes
Moooove over, there's a better deal over there! The fourth segment in a series of eight requires individuals to determine the best unit cost for milk. Scholars calculate the least amount they can spend on a particular quantity of milk....
California Education Partners
Fun on the Farm
Let imaginations run wild as participants design animal pens. A performance task challenges young mathematicians to determine the perimeter or a missing side length of different animal pens. They then design pens that meet given...
California Education Partners
Lashelles Garden
Let knowledge grow bountifully like plants in a garden. Given a diagram of a rectangular garden split into plots, scholars determine the area of the entire garden and the areas of the individual plots. As a culminating activity, they...
California Education Partners
Tile Mural
Paste this resource into your lesson plans like you'd paste a tile onto a mural. Given a diagram of a tile mural with rectilinear figures, future artists determine the perimeters and areas of the figures. They must then develop their own...
Curated OER
Graphing Inequalities in Two Variables
This study guide is a great resource to help you present the steps to graphing linear inequalities. Show your class two different ways to graph an inequality and work on a real-world example together. The document could also be easily...
Curated OER
How Much Does it Cost to Light Your School?
Learners compute the cost of electricity used to light their classroom and their school for various lengths of time. They compute the amount of coal needed to produce the electricity used for one hour of light in their classroom. An...
Statistics Education Web
Sampling in Archaeology
Compare different random sampling types using an archaeological setting. Scholars collect data from an archaeological plot using simple random samples, stratified random samples, systematic random samples, and cluster random samples....
American Statistical Association
An A-MAZE-ING Comparison
Teach your class how to use descriptive statistics through a hands-on data collection activity. Pupils collect their own data, calculate test statistics, and interpret the results in context. They compare male and female results, looking...
American Statistical Association
Colors Challenge!
Does writing the name of a color in a different colored ink affect one's ability to read it? Scholars design an experiment to answer this question. They collect the data, analyze the statistics, and draw a conclusion based on what they...
Statistics Education Web
How High Can You Jump?
How high can your pupils jump? Learners design an experiment to answer this question. After collecting the data, they create box plots and scatter plots to analyze the data. To finish the instructional activity, they use the data to...
Statistics Education Web
Using Dice to Introduce Sampling Distributions
Investigate the meaning of a sample proportion using this hands-on activity. Scholars collect data and realize that the larger the sample size the more closely the data resembles a normal distribution. They compare the sample proportion...
Statistics Education Web
It’s Elemental! Sampling from the Periodic Table
How random is random? Demonstrate the different random sampling methods using a hands-on activity. Pupils use various sampling techniques to choose a random sample of elements from the periodic table. They use the different samples to...
Statistics Education Web
Are Female Hurricanes Deadlier than Male Hurricanes?
The battle of the sexes? Scholars first examine data on hurricane-related deaths and create graphical displays. They then use the data and displays to consider whether hurricanes with female names result in more deaths than hurricanes...
Statistics Education Web
Types of Average Sampling: "Household Words" to Dwell On
Show your classes how different means can represent the same data. Individuals collect household size data and calculate the mean. Pupils learn how handling of the data influences the value of the mean.
Statistics Education Web
Consuming Cola
Caffeine affects your heart rate — or does it? Learners study experimental design while conducting their own experiment. They collect heart rate data after drinking a caffeinated beverage, create a box plot, and draw conclusions. They...
Curated OER
CO2 and You
Students study the scientific evidence about carbon dioxide emissions. They learn to calculate the amount of energy used by different appliances. They complete a worksheet which analyzes the amount of energy that their home uses.
Curated OER
Drops on a Penny
Young scientists explore the concept of surface tension at is applies to water. In this activity, learners use a dropper to place drops of water on a penny. Each group guesses how many drops a heads-up penny will hold, then conducts the...
TryEngineering
What is a Nanometer?
Exactly how small is a nanometer? Scholars investigate the scale of a nanometer by measuring classroom objects and converting these measurements to nanometers.
Bowland
Reducing Road Accidents
By making the following changes to the roads, we can prevent several accidents. A multiple-day lesson prompts pupils to investigate accidents in a small town. Pairs develop a proposal on what to do to help reduce the number of accidents....
Mascil Project
Amberhavn: New Bus Network
Public transportation is an important aspect of any growing city. Collaborative groups work to redesign a system for a city in need of restructuring. Young scholars design a route, create a timetable, and incorporate a quality control...


