Texas Instruments
Is It or Isn't It Proportional
How can you tell if number relationships are proportional? Mathematicians investigate proportional relationships. They compare and contrast functions and graphs to determine the characteristics of proportional relationships, as well as...
Curated OER
Graphing Inequalities in Equations
Can a person solve and graph inequalities in one variable? Sounds impossible but it's not! Young mathematicians solve and graph inequalities in algebraic equations. They find a range of possible values for a variable as they solve...
Illinois State Board of Education
Solar System
Aspiring astronomers solve problems involving mixed units of the same attribute, including time, money, length, and area. They convert large numbers into scientific notation, then compute and compare ratios to explain why drawing...
Curated OER
Reader Rabbit Math!
Learners engage in an integrated lesson with a unit on inequalities.This math computer-based software lesson will utilize Reader Rabbit Math! The lesson is designed for students that are learning inequalities and basic computer skills.
Curated OER
Frequency Tables
Seventh graders construct frequency tables and box-and-whisker plots. After constructing tables and plots, they take a quiz on mean, median, mode, range, scientific notation, and number properties.
Curated OER
Not So Snappy 11
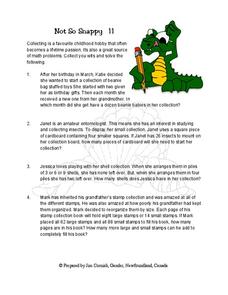
In this word problem worksheet, students discover a creative way to practice math word problems - through childhood hobbies. With four word problems each ranging from collecting beanie bags, insects, shells, and stamps any student can...
Curated OER
Properties of Trigonometric Functions
In this properties of trigonometric functions worksheet, students complete 4 sections consisting of 15 problems involving problem solving using Pythagorean and trigonometric identities and sketching functions..
American Statistical Association
Bear Hugs
Scholars research arm span to determine who gives the best bear hugs. They use data from a national study to find the standard statistics for arm span. It includes mean, median, quartiles, spread, standard deviation, and more.
American Statistical Association
Tell it Like it is!
Scholars apply prior knowledge of statistics to write a conclusion. They summarize using correct academic language and tell the story of the data.
American Statistical Association
How Fast Are You?
Quick! Snap up the instructional activity. Scholars first use an online app to collect data on reaction times by clicking a button when the color of a box changes. They then plot and analyze the data by considering measures of center,...
Virginia Department of Education
Linear Curve of Best Fit
Is foot length to forearm length a linear association? The class collects data of fellow scholars' foot length and the length of their forearms. They plot the data and find a line of best fit. Using that line, they make predictions of...
Mascil Project
Closed Greenhouses
Controlling the efficiency of a greenhouse is a mathematical task. A collaborative project challenges learners to create an efficiency plan for a closed greenhouse. Using algebraic equations, they consider a set of constraints, design...
American Statistical Association
Armspans
Young mathematicians collect data on the arm spans of classmates. Then they sort the data by measures of center, spread, and standard deviation. Finally, they compare groups, such as boys and girls, to interpret any differences.
Institute of Electrical and Electronics Engineers
Spring Scale Engineering
After examining how a spring scale works, teams work together to design their own general measurement device. Reading material provides background information, but there is no part of the procedure in which learners handle an actual...
Curated OER
Volume Review
Learners investigate the concepts of volume for rectangular prisms and spheres. They measure the volume of one balloon and then consider how many breaths it would take to fill the room with balloons. The rectangular prism being measured...
Curated OER
Counting: Skip Counting
In this skip counting worksheet, students solve 10 problems that require them to skip count as indicated in the instructions for each problem set. Students fill in 9 blanks in each set. The range of numbers on this worksheet is 1-102.
Curated OER
Counting: Skip Counting 2
In this skip counting worksheet, learners solve 5 problems that require them to skip count as indicated in the instructions for each problem set. Students fill in 9 blanks in each set. The range of numbers on this worksheet is 1-100.
Curated OER
Away we Go
Students work in groups to calculate the costs of a trip to Six Flags amusement park. In this domain and range lesson, students calculate the least and greatest amounts of money needed for tickets, food, souvenirs, and airplane tickets.
Curated OER
Telling Time to 5 Minutes
Learners take part in various activities ranging from creating a human clock, to small group problem solving to reinforce the concept of telling time accurately to five minutes on an analog clock.
Curated OER
Pizzas And Things
First graders problem solve using the concepts of doubling and halving numbers as previews for finding multiples and working with fractions. They determine how to find half of a set of objects and work with sums up to 16. They work with...
Curated OER
Home on the Range
Third graders see how to find the range of a set of numbers by analyzing data. After a lecture/demo, student pairs practice finding mode and range by solving problems put up on the board by the teacher.
Workforce Solutions
30 Seconds
Thirty seconds are all scholars have to develop an engaging commercial to showcase their talents and experience within a specific occupation. Pairs work collaboratively to keep each other on time to deliver information speedily and ask...
Statistics Education Web
Saga of Survival (Using Data about Donner Party to Illustrate Descriptive Statistics)
What did gender have to do with the survival rates of the Donner Party? Using comparative box plots, classes compare the ages of the survivors and nonsurvivors. Using the same method, individuals make conclusions about the gender and...
Curated OER
Digger and the Gang
Help online friends Digger and Sprat from the BBC series to solve math problems! In a series of activities, your class will use data sets to calculate measurements, averages, means, and probabilities. The class completes worksheets and...


