Curated OER
Surface Area and Volume
In this comprehensive worksheet, young geometers solve a number of surface area and volume problems. Problems range from basic formula-based calculations to more challenging geometric figures and word problems.
Curated OER
Dragonfly
The speed of a dragonfly brings math into the real world as your learners collaboratively see the value in calculating unit rates in direct proportion problems. This six-phase lesson encourages you, as the teacher, to only ask questions...
Willow Tree
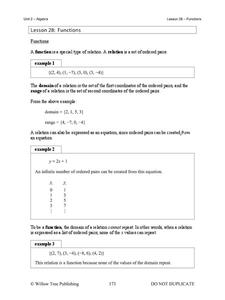
Functions
What makes a function a function? Learn the criteria for a relation defined as a function both numerically and graphically. Once young mathematicians define a function, they use function notation to evaluate it.
Flipped Math
Unit 10 Review: Quadratics
Everything one wanted to know about parabolas in one place. Pupils work 27 problems as a review of the unit on quadratics. Problems range from determining key features of the function and using that information to graph the parabola, to...
Mathematics Vision Project
Module 5: Features of Functions
The language and features of functions get careful treatment in a complex but doable lesson. Learners get a lot of practice really figuring out what a graph means in context, and also identifying key features of graphs. Key ideas like...
Curated OER
Real-World Reasonableness
Fifth graders apply math to real-world situations. In this mathematics lesson plan, 5th graders are read the book, "Math Curse," which discusses ways in which math is used each day. Students then write a sequel to the book in groups,...
Curated OER
Topic 2.1 - Relations and Functions
In this function worksheet, students state the domain and range of 2 functions. They then determine whether 7 relations are functions or not. Finally, students solve 6 problems in which they find the value of a specific function.
Curated OER
Inverse Functions 8-8
In this inverse function worksheet, students find the inverse function of given values. This two-page worksheet contains 12 multi-step problems.
Curated OER
Definition of a Function
Get those kids to solve and graph 10 different problems that include various types of functions and their relations. They determine if each graph represented is the relation of a function then determine which value of the variable will...
Curated OER
Calculating Range for a Constant Velocity
Students read an explanation from the NASA Web-based "textbook", The Beginner's Guide to Aerodynamics, then use the information in combination with data from other Web sites to solve single variable equations for distance (range), time,...
New Zealand Ministry of Education
Addition and Subtraction Pick n Mix
Teach your class how to mentally solve whole number addition and subtraction problems using compensation from tidy numbers including equal additions. They use appropriate recording techniques and predict the usefulness of strategies for...
Noyce Foundation
Through the Grapevine
Teach statistics by analyzing raisins. A thorough activity provides lesson resources for five levels to include all grades. Younger pupils work on counting and estimation, mid-level learners build on their understanding of the measures...
Curated OER
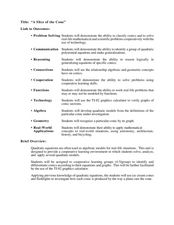
"A Slice of the Cone"
Here is a set of lessons that explore conics in a number of different ways. Starting with modeling how a conic is produced by the way a plane cuts the cone, to solving complex word problems, algebra learners progress through a series of...
American Statistical Association
Scatter It! (Using Census Results to Help Predict Melissa’s Height)
Pupils use the provided census data to guess the future height of a child. They organize and plot the data, solve for the line of best fit, and determine the likely height and range for a specific age.
Yummy Math
Deflate-gate
Does temperature affect the air pressure of a football? Young mathematicians look at the readings from a pressure gauge and determine if the balls are within regulation or are under inflated.
Howard County Schools
Drawing Inverses
An Algebra II lesson draws the connection between the exponential function and its inverse. By graphing an exponential function and using tables and a calculator, students graph the logarithmic function. The plan comes with a launch,...
College Board
2001 AP® Statistics Free-Response Questions
Develop a complete understanding of the course. Pupils and teachers use the six free-response questions to gather information about aspects of the AP® Statistics course. The resource and test section show how items cover the content. A...
Curated OER
Data Management and Probability: Applications
In this data management and probability applications activity, 7th graders solve 13 different types of problems that include finding the mean, median, mode, and range of each set of values, as well as, solving a number of word problems....
Curated OER
T-Shirt Lettering
Learners determine the cost of a t-shirt using a variety of mathematical operations to solve problems. Then they use a spreadsheet to calculate the cost of lettering a t-shirt and display this information in a graph.
Curated OER
Statistics - Central Tendency
In this statistics activity, students solve and complete 13 different problems that include creating various box-and-whisker plots. First, they write a definition for mean, median, mode and range. Then students explain how to determine...
Curated OER
Graphing
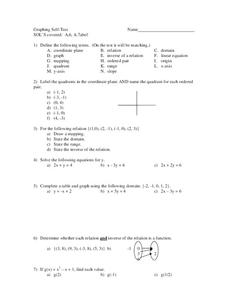
In this graphing worksheet, 9th graders solve and graph 8 different problems that include defining various terms related to graphing. First, they label the quadrants in a coordinate plane and name the quadrant for each listed ordered...
Curated OER
Relations and Functions
In this relations and functions worksheet, 11th graders solve and complete 10 various types of multiple choice problems. First, they use the same relation between two variables as the given table to determine the value of one variable...
Curated OER
Measures of Central Tendency
For this measures of central tendency worksheet, students solve and complete 6 different problems. First, they count the number of items in each set of data. Then, students determine the mean, median and mode for each. In addition, they...
Curated OER
Box-and-Whisker Plots
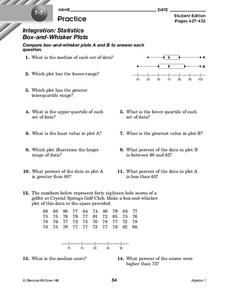
In this box-and-whisker plots worksheet, 9th graders solve and complete 14 different problems that include comparing various box-and-whisker plots. First, they determine the median for each set of data and plot the lesser range. Then,...


