Curated OER
Fraction Reaction
Students review how to solve problems with fractions. In groups, they participate in a card game in which they identify the fraction and its equivalent. They also complete a worksheet related to fractions and have a partner check their...
Curated OER
Five Minute Adding Frenzy (B)
In this addition review worksheet, students use their math skills to solve 100 problems that require them to find sums of the numbers in the columns and rows of the chart as quickly and accurately as possible.
Curated OER
Finding Probability
Sixth graders explore the math concept of probability. In this probability lesson, 6th graders examine visual examples of finding probability. Students also practice solving problems that their instructors model.
Curated OER
Global Statistics
Students determine statistics based on data. In this statistics lesson, students use data and record in charts. Students create graphs based on the statistics found.
Curated OER
Measuring Body Angles
Learners use technology to graph and compare angles. In this geometry lesson, students range of motion in the environment. They identify the missing parts of polygons using similarity and congruence.
Curated OER
Functions
Students explore a variety of functions. They recognize and describe functions and use linear functions to describe situations. Students find the domain and range of linear functions and graph rational expressions.
Curated OER
Exponent Power
Learners explore multiplication and division problems using exponents. Students examine positive, negative and zero powers. They relate powers to geometric sequences. Learners devise strategies and discover rules of exponents.
Curated OER
Three Circles II
Fourth graders practice a variety of strategies when investigating what happens when they put various numbers into circles of a configuration: they express a fraction as a decimal, write and solve problems involving decimal...
Curated OER
The Three Cold Kittens
Students solve a math word problem involving repeated addition. They identify the important information in the problem, brainstorm ways to solve the problem, and solve the problem and discuss the solution as a class.
Curated OER
Linear Functions
Students solve and graph linear equations. In this algebra instructional activity, students collect data and plot it to create a linear function. They identify the domain and range of each line.
Curated OER
Counting Cubes
Students count backwards in 2s from 30 then try other skip patterns such as 1,3,5, etc. and invent their own counting patterns. They are introduced to the problem using a pile of cubes and count by 2s and have a remainder.
Curated OER
Arithmagons
Fifth graders explore patterns and relationships among the numbers that form arithmagons. They create and attempt different rules that can be used to solve arithmagons. Students use linear algebra to solve arithmagons.
Curated OER
Childhood Obesity
Students identify a question to generate appropriate data and predict results. They distinguish between a total population and a sample and use a variety of methods to collect and record data. Students create classifications and ranges...
Curated OER
Probability and Statistics
In this probability and statistics worksheet, students solve independent and dependent probability problems. They identify the mean, mode and range of a set of numbers. This two-page worksheet contains five probability problems.
Curated OER
Counting: Skip Counting 3
In this skip counting worksheet, students solve 10 problems that require them to skip count as indicated in the instructions for each problem set. Students fill in 9 blanks in each set. The range of numbers on this worksheet is 1-100.
Curated OER
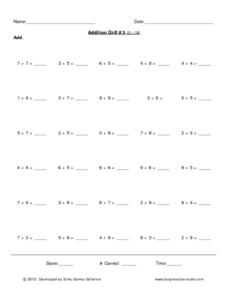
Addition Drill #3 (0-18)
In this math worksheet, 2nd graders solve 30 single-digit addition problems with sums ranging from 0 to 18. Students notate their score, # correct and time.
Curated OER
Addition Drill #3 (0-10)
In this math worksheet, 2nd graders solve 30 single-digit addition problems whose sums range from 0 to 10. Students notate their score, # correct and time.
Curated OER
How Long Does It Take?
Students investigate the lengths of time various activities take and calculate how long is spent on these activities in a week. They complete a worksheet for each activity that is timed, and calculate lengths of time for simulated...
Curated OER
How Much Does it Cost to Light Your School?
Learners compute the cost of electricity used to light their classroom and their school for various lengths of time. They compute the amount of coal needed to produce the electricity used for one hour of light in their classroom. An...
Statistics Education Web
Sampling in Archaeology
Compare different random sampling types using an archaeological setting. Scholars collect data from an archaeological plot using simple random samples, stratified random samples, systematic random samples, and cluster random samples....
American Statistical Association
An A-MAZE-ING Comparison
Teach your class how to use descriptive statistics through a hands-on data collection activity. Pupils collect their own data, calculate test statistics, and interpret the results in context. They compare male and female results, looking...
American Statistical Association
Colors Challenge!
Does writing the name of a color in a different colored ink affect one's ability to read it? Scholars design an experiment to answer this question. They collect the data, analyze the statistics, and draw a conclusion based on what they...
Statistics Education Web
How High Can You Jump?
How high can your pupils jump? Learners design an experiment to answer this question. After collecting the data, they create box plots and scatter plots to analyze the data. To finish the instructional activity, they use the data to...
Statistics Education Web
Using Dice to Introduce Sampling Distributions
Investigate the meaning of a sample proportion using this hands-on activity. Scholars collect data and realize that the larger the sample size the more closely the data resembles a normal distribution. They compare the sample proportion...


