Curated OER
One, Two, Three...and They're Off
Students make origami frogs to race. After the race they measure the distance raced, collect the data, enter it into a chart. They then find the mean, median, and mode of the data. Next, students enter this data into Excel at which time...
Curated OER
Gender Issues through Chi-square Experiments
Students investigate teachers and gender preference. In this statistic lesson, students collect data of teachers calling on students to see if they are calling on one gender more than the other. Students examine the data and draw...
Curated OER
Linear Patterns in Data
Eighth graders extend their learning of graphing linear equations and are introduced to connecting patterns in tables and graphs to represent algebraic representations. They then determine patterns and extrapolate information from these...
Curated OER
The Seasonal Round and The Cycle of Life
Fourth graders are introduced to the concept of the seasonal round and how folklife traditions vary from season to season. They begin charting dates of personal interest on seasonal round calendars by starting with birthdays. Students...
Other
University at Albany: Populations and Samples: The Principle of Generalization
This resource explains what generalization is in statistics, its advantages and disadvantages, and problems that can occur, e.g., sample or response bias. Includes detailed examples of sampling error and sample bias.
CK-12 Foundation
Ck 12: Statistics: Sampling Methods
[Free Registration/Login may be required to access all resource tools.] Decide how to choose a sampling of a population to produce reliable statistical results.
University of Georgia
University of Georgia: Inter Math: Sample
This site gives a description of a sample (of a population). The page offers information on various types of sampling. There are links to related terms, everyday examples, more information, and the interactive check point involving...
Illustrative Mathematics
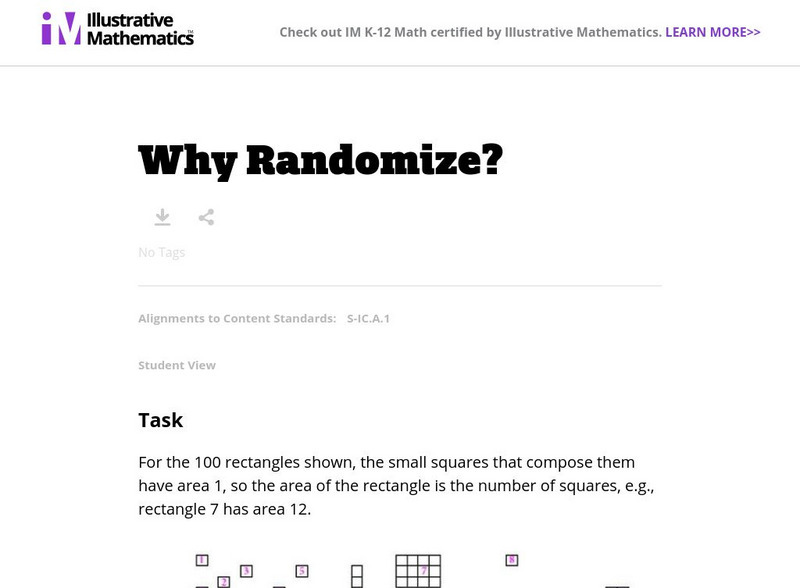
Illustrative Mathematics: S Ic Why Randomize?
The exercise demonstrates that judgment (non-random) samples tend to be biased in the sense that they produce samples that are not balanced with respect to the population characteristics of interest. Students will estimate the mean...
Annenberg Foundation
Annenberg Learner: Sampling the Electorate
As the pollster for candidate Higgins, you need to know how she is faring with different groups. Read her political profile, view the demographic profile of the city, decide on the groups to poll, review the results and learn about...
SMART Technologies
Smart: Sampling and Misleading Graphs
Teachers can use Smart Exchange to download a SMART Notebook lesson covering the topic of sampling and misleading graphs.
Education Place
Houghton Mifflin: Eduplace: Math Steps: What Is It? Data
This is a great place for lesson information on the concept of analyzing data - measures of central tendency. Three other tabs are available besides the "What Is It?" link. Tips and Tricks, When Students Ask, and Lesson Ideas also...
Mangahigh
Mangahigh: Data: Practical Ways to Carry Out a Survey
Students learn about the concept of taking a survey by exploring a tutorial. They can then test their knowledge by taking a ten question assessment that increases in difficulty as they correctly answer questions.


