Curated OER
Home Sweet Home
Students examine the change in the diversity of animals living in an area before and after development. In order to do this, students need to have access to an area near their school which is undeveloped. A good, "real life" lesson.
Curated OER
What in the World?
Eighth graders plot points of longitude and latitude on a world map. In groups, they create a model of the earth's interior and label the parts,
Curated OER
Ecology - Biodiversity Lab
Studnents examine the degree of biodiversity that exists in one's everyday environment, in order to develop an understanding of how scientists classify organisms and to explain why biodiversity is important for living things.
Curated OER
Probability
Fifth graders study probability of events. They predict outcomes, and participate in hands-on experiments to find the probability of specified events. Afterward, 5th graders write probability of events in fractions and decimals.
Curated OER
Floating Soap
Students use the Scientific Method steps to complete an experiment on various brands of soap to determine their floating capabilities. In this scientific method lesson, students write a hypothesis about the ability of various soap bars...
Curated OER
Toting the Log and Lifting the Babe
Students use simple machines that demonstrate force, friction, work and power. They investigate and explain simple machines.
Curated OER
Probability: Playing with Fire
Students use probability to determine how likely it is for each tree in a small forest to catch on fire.
Curated OER
Pure Substances and Mixtures
Students compare and contrast the properties of substances and mixtures. In this chemistry lesson plan, students simulate spontaneous mixing by performing a short class activity. They differentiate heterogeneous and homogeneous mixtures.
Curated OER
Insect Classification
Students compare and contrast the visible structures of three insects based on photographs. They differentiate characteristics of crane flies, ants, and wasps then create a simple classification system.
Curated OER
How Science Works: Natural Selection
Students are introduced to the topic of adaptation and discuss how various animals adapt to their environment. In groups, they participate in a simulation in which they are selected based on criteria. They discuss the results and relate...
Curated OER
Earthquake Plotting
Learners become familiar with map coordinates. They establish the frequency of earthquake occurrences and study the location and magnitude of earthquakes. To establish the location of plate boundaries.
Curated OER
What do we need to know before going online?
Students explore, examine and study about digital cameras, downloading photos, painting tools, word processing and identifying legal, ethical and human practice relating to technology use by minors. They identify potential ethical...
Vision Learning
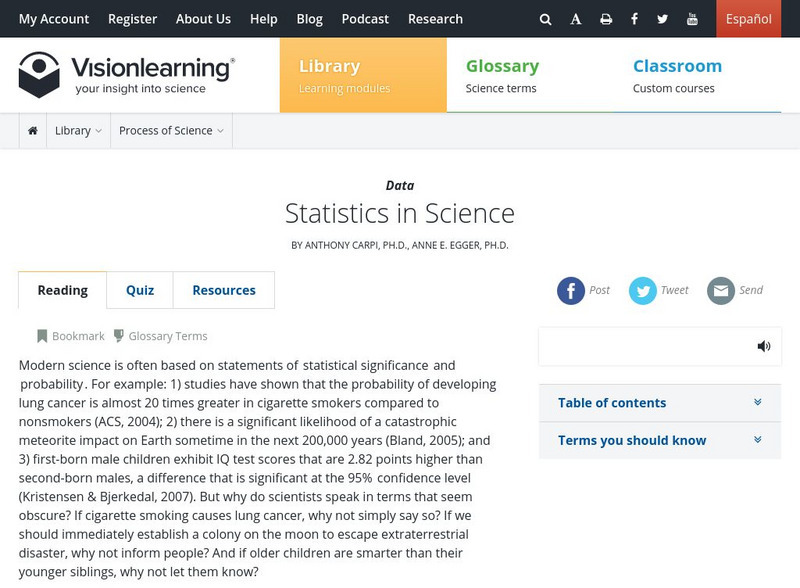
Visionlearning: Data: Statistics in Science
An explanation of how statistics allows scientist to explore the degree of uncertainty that accompanies conclusions that are based on data collected during experimentation and research.
Vision Learning
Visionlearning: Data: Uncertainty, Error, and Confidence
An explanation of how errors may affect data that has been collected for experimentation. Some examples are given.
Texas Instruments
Texas Instruments: Collecting Data
In this activity, students investigate how to use random numbers to collect samples and how to randomly assign subjects to experiments to collect data. They also use the CBL system to collect data in real time.
Mangahigh
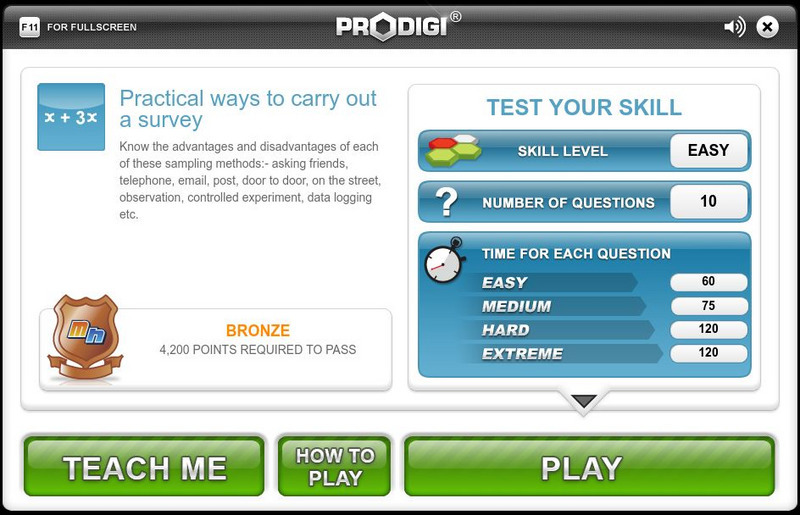
Mangahigh: Data: Practical Ways to Carry Out a Survey
Students learn about the concept of taking a survey by exploring a tutorial. They can then test their knowledge by taking a ten question assessment that increases in difficulty as they correctly answer questions.
Annenberg Foundation
Annenberg Learner: Interactives: Cast Your Vote!
Upper elementary, middle, and high school students can use this exhibit to get an understanding of how polls and elections are conducted. The discussion includes random samples, margins of error, and other concepts related to statistics.
Texas Instruments
Texas Instruments: Gemini Candy
In this activity, students work in groups to collect data and draw conclusions from random samples simulated by drawing tiles from a bag. They represent the data collected in the form of a triple bar graph.
Texas Instruments
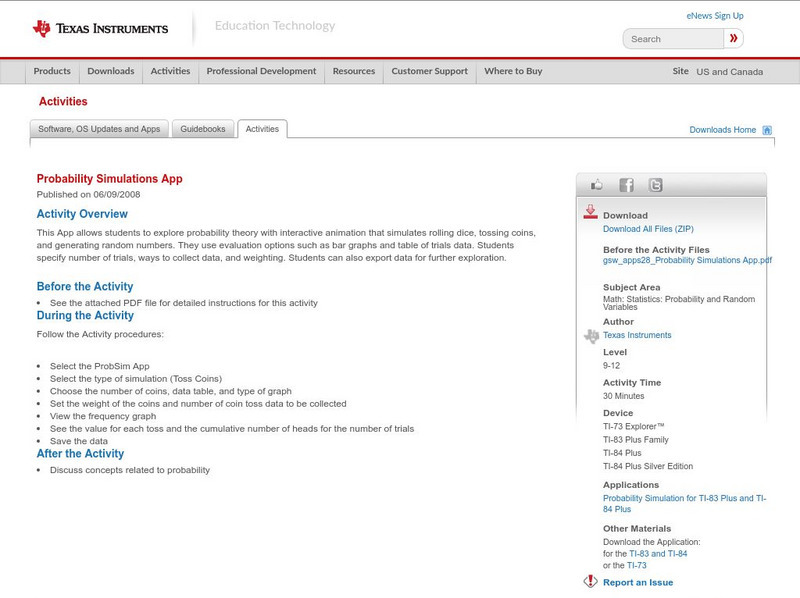
Texas Instruments: Probability Simulations App
This App allows students to explore probability theory with interactive animation that simulates rolling dice, tossing coins, and generating random numbers. They use evaluation options such as bar graphs and table of trials data....
Thinkport Education
Thinkport: Algebra Ii: Inferences
Focus on the development and collection of data, emphasizing the importance of simple random sampling.
Illustrative Mathematics
Illustrative Mathematics: S Ic Words and Music Ii
Given a hypothetical situation, students will decide if this is an experiment or observational study and why? They will also learn the importance of random assignments in this particular example. Explanations are provided.
Other
Statistics Education Web: Bubble Trouble [Pdf]
Use random sampling to formulate, collect, and compare data from two populations. Written by Peter Banwarth of Oregon State University.
Texas Instruments
Texas Instruments: Numb3 Rs: Walkabout
Based off of the hit television show NUMB3RS, this lesson has students simulate a one-dimensional random walk (by either moving up or down) and then finding patterns concerning how many "ways" a walk could end in various spots. The...
Science Education Resource Center at Carleton College
Serc: Reese's Pieces Activity: Sampling From a Population
Students use Reese's Pieces to investigate the proportion of orange candies present in a set of 25. After collecting data for the class, they use a web applet to collect more data for random samples. This is compared to the actual...












![Statistics Education Web: Bubble Trouble [Pdf] Lesson Plan Statistics Education Web: Bubble Trouble [Pdf] Lesson Plan](https://content.lessonplanet.com/knovation/original/715465-988c4be74f96df36c2d9bcb6f2f5182f.jpg?1661829195)

