Curated OER
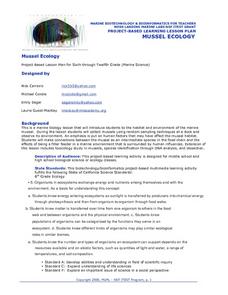
Mussel Ecology
Students are introduced to the marine environment of the mussel. The emphasis of the lesson is upon what human factors are present to influence the environment in positive and negative ways. They brainstorm in groups in order to conduct...
Curated OER
English Vocabulary Skills: AWL Sublist 6 - Exercise 4c
In this online interactive English vocabulary skills worksheet, students answer 10 matching questions which require them to fill in the blanks in 10 sentences. Students may submit their answers to be scored.
Curated OER
Lesson 6-7: Scatter Plots and Equations of Lines
For this scatter plot worksheet, students examine tables and write a linear equation that matches the table. Students graph linear equations. They read scatter plots, determine the trend line, and write a linear equation to match...
Curated OER
Brays Bayou Spiderwort Genetic Study
Students formulate hypothesis based upon data gathered by examining possible crosses of spiderworts using Punnett squares. They present explanations for physiological adaptations of spiderworts that resulted from interactions within the...
American Statistical Association
Bubble Trouble!
Which fluids make the best bubbles? Pupils experiment with multiple fluids to determine which allows for the largest bubbles before popping. They gather data, analyze it in multiple ways, and answer analysis questions proving they...
Curated OER
Confidence Levels
Learners collect data and graph it. In this statistics lesson, students rate confidence levels by collecting data and analyzing it. They graph their findings on the Ti calculator.
Curated OER
Foreign Language: Travel Brochure
Students research either French or Spanish speaking countries. After compiling information covering the geography, people,government, economy, and culture, they produce travel brochures on their respective countries.
Curated OER
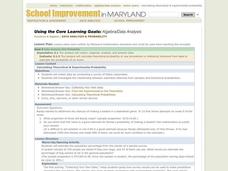
Calculating Theoretical & Experimental Probability
Students explore the concept of experimental and theoretical probability. In this experimental and theoretical probability lesson, students collect data by conducting a survey of their classmates. Students compare their data and discuss...
Curated OER
Statistics: Final Exam Review
In this statistics and probability worksheet, students are provided with a review of the final exam in statistics. The three page worksheet contains a combination of six multiple choice and free response questions. Answers are not...
Curated OER
CATCH, TAG and RELEASE
Learners apply estimation strategies for problem-solving purposes. They become familiar with one aspect of a marine biologist's work.
Curated OER
Loyalists
Students explain why some colonists remained loyal to England during the American revolution. In this social studies activity, students write a letter to an editor about their reasons for remaining loyal to England.
Curated OER
Survey Project
Eighth graders create a website using FrontPage. They use inserted forms to collect survey information and use Microsoft Excel and MS Word to create a presentation of the survey and the results.
Curated OER
Statistics: Misleading or Accurate?
Students explore the concept of misleading statistics. In this misleading statistics lesson, students play a game of tag and graph the number of times each student gets tagged. Students use the graph to determine the fastest runner in...
Curated OER
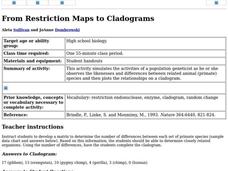
From Restriction Maps to Cladograms
Learners develop a matrix to determine the number of differences between each set of primate species. They determine closely related organisms then complete the cladogram and answer a set of questions.
Curated OER
Insect Classification
Students compare and contrast the visible structures of three insects based on photographs. They differentiate characteristics of crane flies, ants, and wasps then create a simple classification system.
Khan Academy
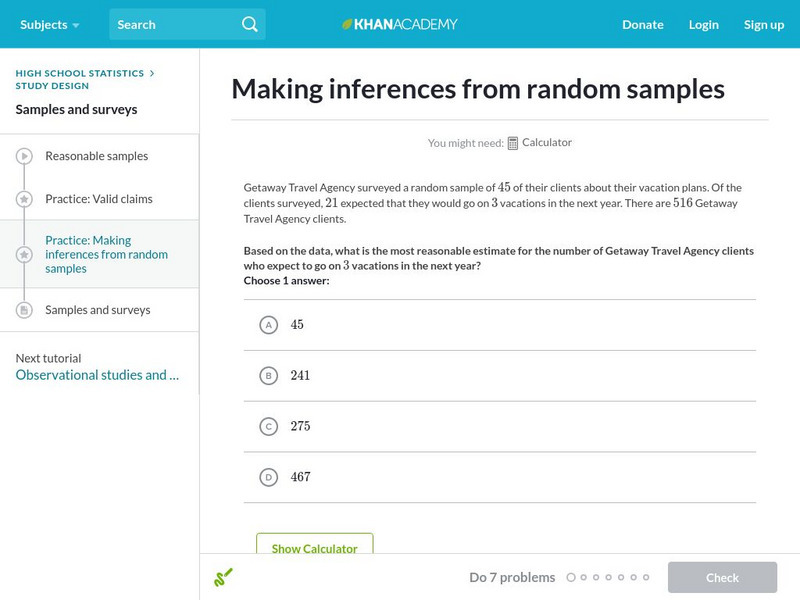
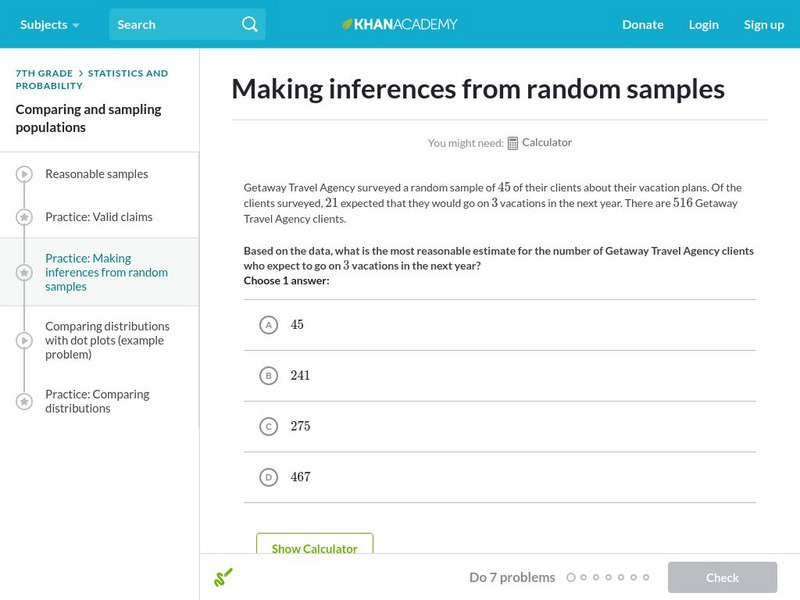
Khan Academy: Making Inferences From Random Samples
Given a random sample, practice figuring out what can we reasonably infer about the entire population? Students receive immediate feedback and have the opportunity to try questions repeatedly, watch a video or receive hints.
Khan Academy
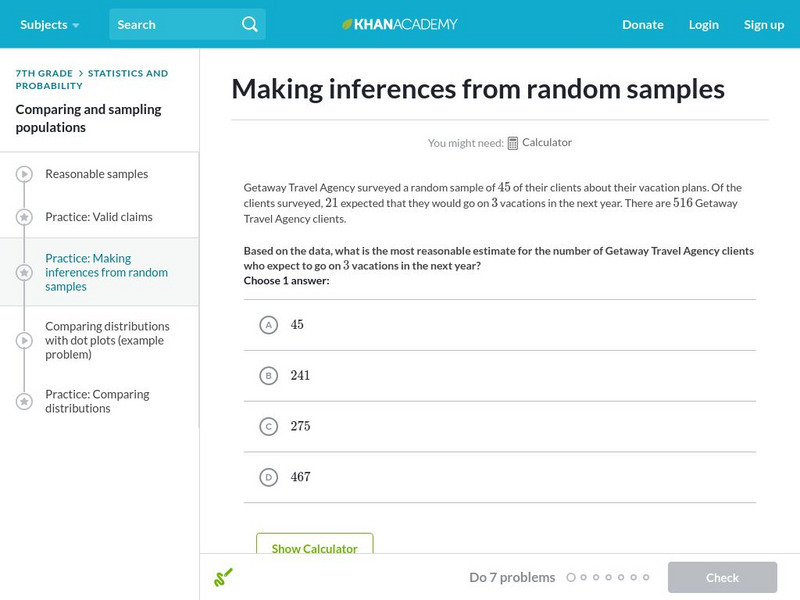
Khan Academy: Making Inferences From Random Samples
Practice making inferences from random samples.
Texas Education Agency
Texas Gateway: Generalizing About Populations From Random Samples
Given a population with known characteristics, students will be able to use a variety of methods to generate random samples of the same size in order to understand how a random sample is representative of a population.
PBS
Pbs Learning Media: Estimation From Random Sampling
Practice estimating wildlife population by using the process of random sampling.
Khan Academy
Khan Academy: Making Inferences From Random Samples
Practice making inferences from random samples.
Other
Nearpod: Random Sampling
In this lesson, 7th graders will learn how to use random sampling to make generatlizations and predictions about a population.
Thinkport Education
Thinkport: Algebra Ii: Inferences
Focus on the development and collection of data, emphasizing the importance of simple random sampling.
US Census Bureau
Population Pyramids
Visual representations of population distribution by age and sex for any country.
Science Education Resource Center at Carleton College
Serc: Reese's Pieces Activity: Sampling From a Population
Students use Reese's Pieces to investigate the proportion of orange candies present in a set of 25. After collecting data for the class, they use a web applet to collect more data for random samples. This is compared to the actual...


