Curated OER
Bikini Bottom Olympics Skill: Best Value and Uncertainty
In this best value and uncertainty worksheet, students solve multiple problems where they calculate the best value, the uncertainty and the range in the data given.
Curated OER
Unit 18 Quantitative Data
In this central tendency worksheet, students answer 30 short answer questions about data sets. Students find the median, mean, mode, and range of data sets.
Curated OER
Introduction to Measures of Central Tendency and Variability
Young scholars calculate the mean, median, mode, range, and interquartile range for a set of data. They create a box and whisker plot using paper, pencil and technology.
Curated OER
Statistics - Central Tendency
In this statistics activity, students solve and complete 13 different problems that include creating various box-and-whisker plots. First, they write a definition for mean, median, mode and range. Then students explain how to determine...
Curated OER
Measures of Central Tendency
For this measures of central tendency worksheet, students solve and complete 6 different problems. First, they count the number of items in each set of data. Then, students determine the mean, median and mode for each. In addition, they...
Curated OER
Calculus 30 - Typical Exam Questions
In this limits and functions worksheet, students solve 30 short answer questions about calculus Students find limits, domain, range, tangent lines, derivatives, and composition functions.
Curated OER
Box-and-Whisker Plots
In this box-and-whisker plots worksheet, 9th graders solve and complete 14 different problems that include comparing various box-and-whisker plots. First, they determine the median for each set of data and plot the lesser range. Then,...
Curated OER
Not Your Average Planet
Fourth graders explore median, mode, mean, and range using information about the planets and our solar system.
Curated OER
Create Your Own Form
Students gather and organize data using a mock census form, and determine mean, mode, range, and median for sets of data.
Curated OER
Data Scavenger Hunt
Eighth graders discuss how data is collected and participate in data collection through a survey. They complete a scavenger hunt on the Internet to gain understanding of the data measures mean, median, mode, and range.
Curated OER
Plot It
Students use a stem-and-leaf plot from a set of data to identify the range, median, and mode of their own math grades.
Curated OER
Names Count!
Second graders work in small groups to complete a graph and use data to determine range, mode, and median. They use the number of letters in their names and in fairy tale characters names to produce their data. This is a fun lesson!
Curated OER
Graphing Functions
In this graphing functions worksheet, 11th graders solve and complete 10 different types of problems. First, they graph each function and list the asymptote, domain and range for each. Then, students sketch each graph. They also draw and...
Curated OER
Chapter 7. Functions and Graphs
In this functions and graphs worksheet, students determine the domain and range of a given relation. They graph functions on a coordinate plane and write equations in the slope-intercept form. This twelve page worksheet contains 30...
Curated OER
What Does Average Look Like?
Fifth graders explore the concepts of range, median, mode, and mean through the use of graphs drawn from models. They use manipulatives to represent data they have collected within their groups, and compare the differences between mode,...
Curated OER
Data Management and Probability: Applications
In this data management and probability applications activity, 7th graders solve 13 different types of problems that include finding the mean, median, mode, and range of each set of values, as well as, solving a number of word problems....
Curated OER
Data Management and Probability: Applications
In this data management and probability applications learning exercise, 8th graders solve 20 various types of probability problems. They find the mean, median, mode and range of various numbers. Then, students use the spinner...
Curated OER
Inequalities and Measures of Central Tendency
In this inequality and measures of central tendency worksheet, students solve and graph linear inequalities. They organize given data to identify the mean, mode and range. Students interpret box-and-whisker plots. This three-page...
Curated OER
Graphing Logarithms
In this logarithms learning exercise, students identify the domain and range of given logarithms. They sketch the graph on a coordinate plane. This four-page learning exercise contains 12 multi-step problems. Answers are provided on the...
Curated OER
Frequency Tables
Seventh graders construct frequency tables and box-and-whisker plots. After constructing tables and plots, they take a quiz on mean, median, mode, range, scientific notation, and number properties.
Curated OER
Parabolic Equations
In this parabolic activity, students write an equation of a parabola which satisfies given conditions. They match equations to the correct graph. Students identify the vertex, domain and range of an equation. This one-page activity...
Curated OER
Relations and Functions
In this relations and functions worksheet, 11th graders solve and complete 10 various types of multiple choice problems. First, they use the same relation between two variables as the given table to determine the value of one variable...
Curated OER
The Energy of Empty Space
In this energy in empty space worksheet, high schoolers use an equation for Cosmic Inflation to solve eight problems. They find the domain and range of the function of the equation, they determinethe axis of symmetry, they find the...
Curated OER
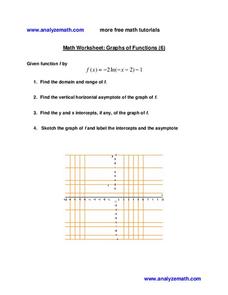
Graphs of Functions
For this graphs of functions worksheet, students identify the domain and range of a function. They determine the vertical horizontal asymptote and find the y and x intercepts. Students sketch a graph of the function. This one-page...
Other popular searches
- Mean Median Mode Range
- Domain and Range
- Mean, Median, Mode Range
- Math Functions Domain Range
- Mean, Median, Mode, Range
- Median Mode Range
- Interquartile Range
- Fossil Range Chart
- Mean Median Mode and Range
- Domain and Range Mapping
- Domain and Range of a Function
- Andes Mountain Range


