Alabama Learning Exchange
Alex: Estimation Station
During this lesson, young scholars will learn the difference between estimation and guessing. Knowing how to estimate is an essential skill that will help students determine approximate totals as well as check the reasonableness of their...
AAA Math
Aaa Math: Central Tendencies Notes
A complete description of mean, median and mode. Interactive games and practice exercises are included.
ClassFlow
Class Flow: Mean, Median, Mode and Range
[Free Registration/Login Required] This interactive flipchart provides an overview of mean, median, mode, and range.
ClassFlow
Class Flow: Mean, Median, Mode, and Range
[Free Registration/Login Required] This flipchart describes the basics of mean, median, mode, and range.
ClassFlow
Class Flow: Mode and Range
[Free Registration/Login Required] In this flipchart, students are introduced to two statistical concepts: mode and range.
ClassFlow
Class Flow: Mean, Mode, Median, and Range
[Free Registration/Login Required] This is a flipchart about mean, mode, median, and range. It also has an assessment using Activotes.
BBC
Bbc Skillswise: Averages and Range
BBC Skillswise provides multiple factsheets, quizzes, activities, and worksheets on averages and variations.
Calculator Soup
Calculator Soup: Descriptive Statistics Calculator
This is a statistics calculator; enter a data set and hit calculate. Descriptive statistics summarize certain aspects of a data set or a population using numeric calculations. Examples of descriptive statistics include: mean, average,...
Missouri State University
Missouri State University: Introductory Statistics: Statistics
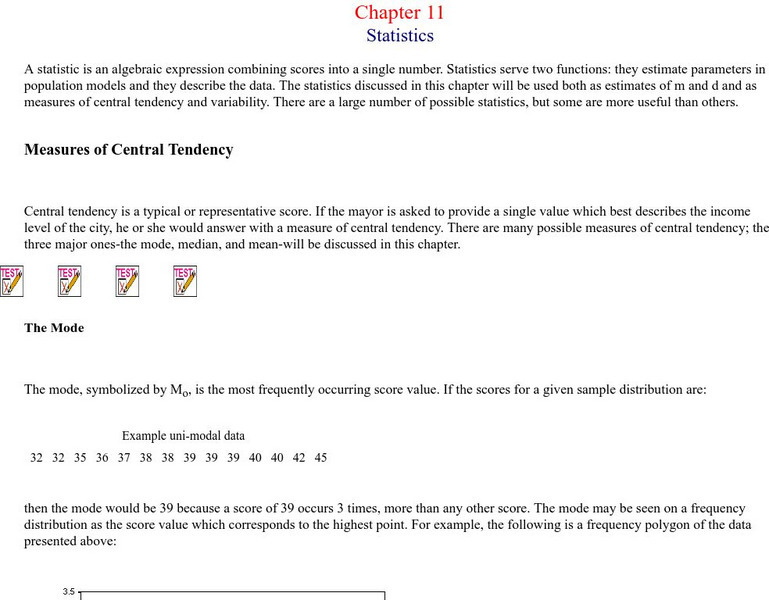
This is an excellent resource on what the science of statistics involves. There are all kinds of definitions, examples, graphs, and charts to learn from. The topics covered include: mode, mean, median, skewed distributions and measures...
Missouri State University
Missouri State University: Introductory Statistics: The Normal Curve
Provides lengthy explanations of the measures of central tendencies - mean, mode, and median - and the measures of variability - range, variance, standard deviation - are given here. Graphs of interesting "side items" are presented as...
Missouri State University
Missouri State U.: Statistics: Measures of Central Tendency and Variability
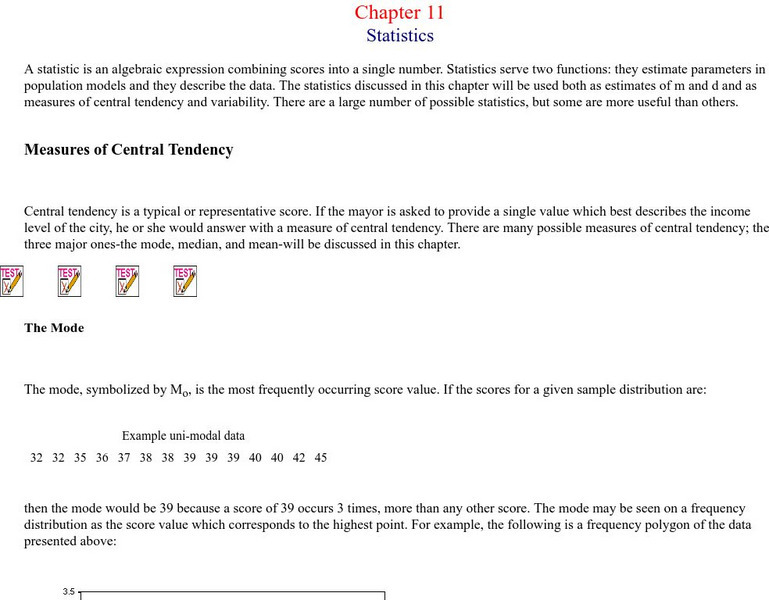
Provides lengthy explanations of the measures of central tendency - mean, mode, and median - and the measures of variability - range, variance, standard deviation. Graphs of interesting examples are presented as well, skewed...
Math Drills
Math Drills: Statistics and Probability Worksheets
Download these free worksheets to sharpen your skills with statistics and probability. Sheets focus on collecting and organizing data, measures of central tendency (mean, median, mode, and range), and probability.
Curated OER
Clip Art by Phillip Martin: Mean Median Mode Range
A clipart illustration by Phillip Martin titled "Mean Median Mode Range."
Other
Csulb: Stem: How Much Water Fits on a Penny? [Pdf]
Students explore mean, median, mode, and range with this hands on activity.
Beacon Learning Center
Beacon Learning Center: All That Data
Students analyze data by finding the mean, median, mode, and range of a set of numbers. Line plots, bar graphs, and circle graphs are also included in this lesson.
Other
Raymond Geddes and Company, Inc.: Analyzing Product Price and Sales Data
Lesson plan provides a real-world application of mean, median, mode, and range.
CK-12 Foundation
Ck 12: Physical Science: Descriptive Statistics
[Free Registration/Login may be required to access all resource tools.] Explains descriptive statistics (mean, median, mode, range).
Other
Magoosh: Statistics Fundamentals
An online course on the fundamentals of statistics including video lessons in Mean, Median, and Mode; Weighted Averages; Quartiles and Boxplots; Range and Standard Deviation; Normal Distribution; Z-scores; Intro to Inferential...
Concord Consortium
Seeing Math: Plop It
Plop It! lets you experiment with the concepts of mean, median, and mode (measures of center). You see the differences among them on a bar graph, as you add or remove blocks to an axis with a given range.
Better Lesson
Better Lesson: Analyze This Part 2!
Srudents connect mean, median, mode and range to real life. It will allow students to make sense of problems by using previously taught strategies.
Beacon Learning Center
Beacon Learning Center: All That Data 2
Students describe graphs and explore range, measures of central tendency, and distribution in this interactive web lesson.
Other
Stat Soft: Statistics Glossary
Dozens of statistical terms are defined and illustrated in this glossary.
Louisiana Department of Education
Louisiana Doe: Louisiana Believes: Eureka Math Parent Guide: Statistics
A guide to support parents as they work with their students with statistics.
Math Slice
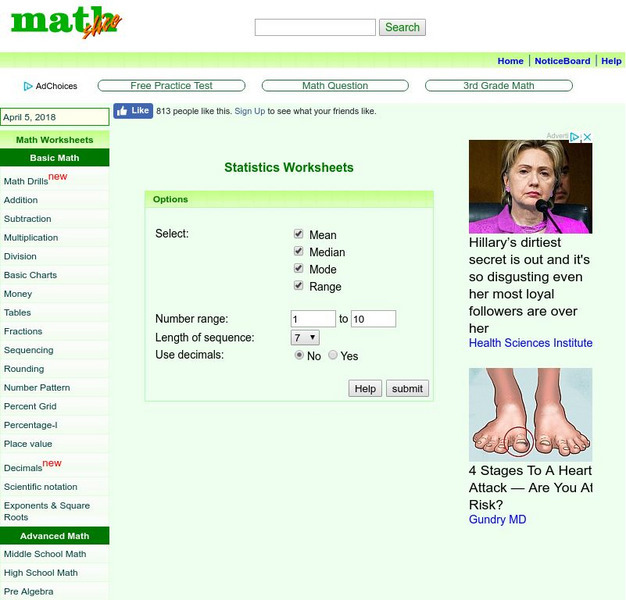
Math Slice: Statistics: Math Worksheets
This tool allows you to create worksheets where students calculate the mean, median, mode or range of a set of numbers.
Other popular searches
- Mean Median Mode Range
- Mean, Median, Mode Range
- Mean, Median, Mode, Range
- Median Mode Range
- Mean Median Mode and Range
- Mean, Median, Mode, and Range
- Mode and Range
- Median Mode and Range
- Mean, Median, Mode and Range
- Median, Mode, Range


