Curated OER
Box Plots on the TI-83 Calculator
Eighth graders research box plots on the Internet. They gather real life statistics and analyze the collected statistics by making multiple box plots on the TI-83 calculator.
Curated OER
Being an Educated Consumer of Statistics
Students examine kinds of data used to report statistics, and create their own statistical report based on any of the four sources of media information (Internet, newspaper, TV, magazine).
Curated OER
Live, From New York
In this data analysis instructional activity, students study the information on a data table about the hosts of Saturday Night Live. Students answer 8 problem solving questions about the table.
Curated OER
Comparison of Two Different Gender Sports Teams - Part 1 of 3 Measures of Central Tendency
Students gather and analyze data from sports teams. In this measures of central tendency lesson, students gather information from websites about sports team performance. Students analyze and draw conclusions from this data. This lesson...
Curated OER
Student Heights
Students measure the heights of their fellow classmates and create a box and whisker plot to display the data. In this measurement lesson plan, students analyze the data and record results.
Curated OER
Univariate Data Analysis
Students use given data to compare baseball players. They create box and whisker plots to compare the players and determine which they feel is the best player. Students use calculators to make box and whisker plots. They write paragraphs...
Cuemath
Cuemath: How to Find Interquartile Range
A comprehensive guide for exploring the topic of interquartile range by finding answers to questions like what is meant by interquartile range, how to find interquartile range, and what is the formula for interquartile range. Includes...
Mangahigh
Mangahigh: Data: Find the Quartiles and Interquartile Range
This site provides students practice with the concept of interquartile range. Students can learn about the topic by completing an interactive tutorial. Students can then take a ten question timed test to practice the skill.
Math Is Fun
Math Is Fun: Quartiles
Explains what quartiles are and some different contexts in which they are used. Includes ten practice questions.
Quia
Ixl Learning: Interquartile Range
Brush up on your math skills relating to interquartile range then try some practice problems to test your understanding.
University of Georgia
University of Georgia: Measures of Variation
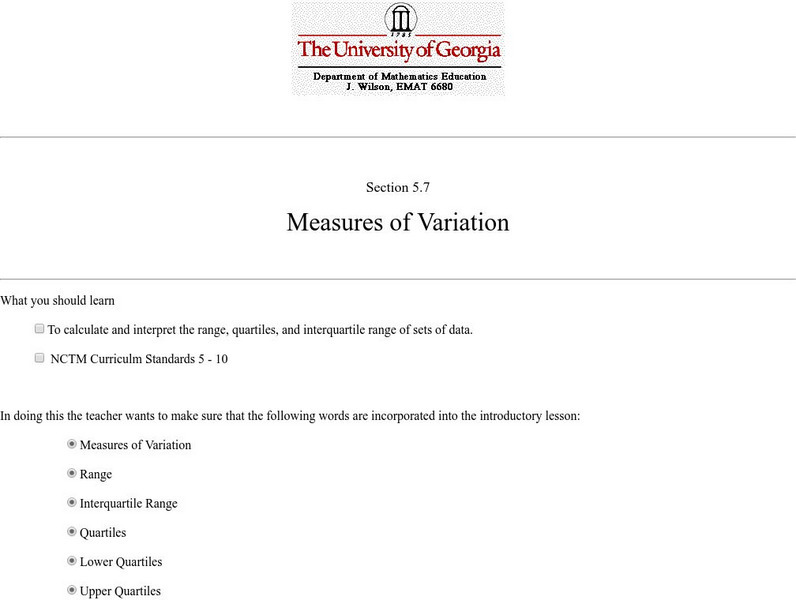
Lesson plan introduces and explains how to calculate measures of variation concepts such as range and quartile.
Calculator Soup
Calculator Soup: Quartile Calculator
This quartile calculator and interquartile range calculator finds first quartile Q1, second quartile Q2 and third quartile Q3 of a data set. It also finds median, minimum, maximum, and interquartile range.
Calculator Soup
Calculator Soup: Descriptive Statistics Calculator
This is a statistics calculator; enter a data set and hit calculate. Descriptive statistics summarize certain aspects of a data set or a population using numeric calculations. Examples of descriptive statistics include: mean, average,...
McGraw Hill
Mc Graw Hill Education: Glencoe: Measures of Variation
Lesson examples that review how to calculate measures of variation such as range and outliers.
Shodor Education Foundation
Shodor Interactivate: Lesson: Box Plots
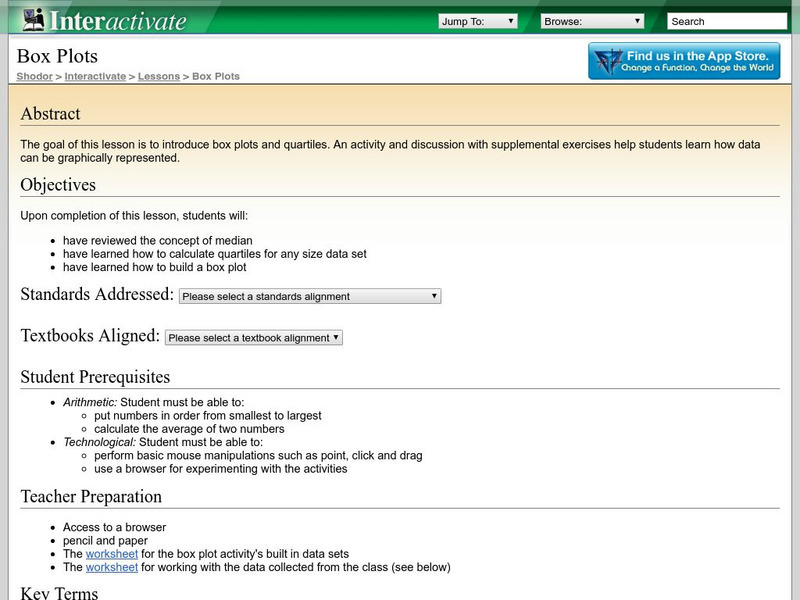
This lesson plan introduces quartiles and box plots. It contains an activity and discussion. Supplemental activities about how students can represent data graphically are also included.
CK-12 Foundation
Ck 12: Statistics: Measures of Spread/dispersion Grades 11 12
[Free Registration/Login may be required to access all resource tools.] This Concept introduces students to the some of the measures of spread commonly used, such as range, standard deviation and variance.
McGraw Hill
Mc Graw Hill Education: Glencoe: Statistics and Probability: Luck of the Draw
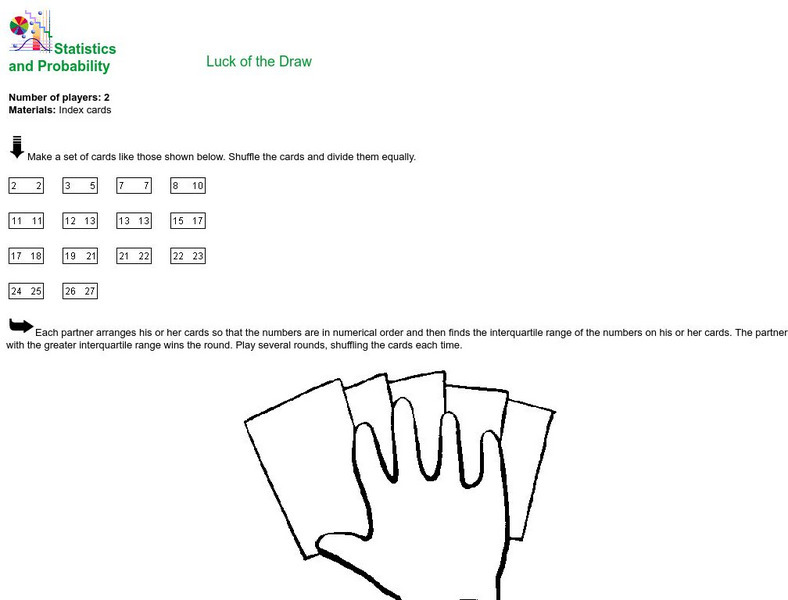
Instructions for creating and playing a simple card game through which students can practice calculating the interquartile range from a set of numbers.
McGraw Hill
Glencoe: Self Check Quizzes 2 Box and Whisker Plots
Use Glencoe's Math Course 2 randomly generated self-checking quiz to test your knowledge of Box-and-Whisker Plots. Each question has a "Hint" link to help. Choose the correct answer for each problem. At the bottom of the page click the...
CK-12 Foundation
Ck 12: Summary Statistics: Summarizing Univariate Distributions
[Free Registration/Login may be required to access all resource tools.] This concept teaches students about other measures of center such as the mid-range, trimmed means and weighted mean. It also introduces the concept of percentiles,...
Shodor Education Foundation
Shodor Interactivate: Box Plot
Students can create box plots for either built-in or user-specified data as well as experiment with outliers. User may choose to use or not use the median for calculation of interquartile range.
Other
Magoosh: Statistics Fundamentals
An online course on the fundamentals of statistics including video lessons in Mean, Median, and Mode; Weighted Averages; Quartiles and Boxplots; Range and Standard Deviation; Normal Distribution; Z-scores; Intro to Inferential...
Texas Instruments
Texas Instruments: Numb3 Rs: "Take Out" Outliers
Based off of the hit television show NUMB3RS, this lesson has students create box-and-whisker plots for given data, and then determine which (if any) data points are outliers. Students determine outliers through two methods in this...
Houghton Mifflin Harcourt
Holt, Rinehart and Winston: Homework Help Independent Practice: Variability
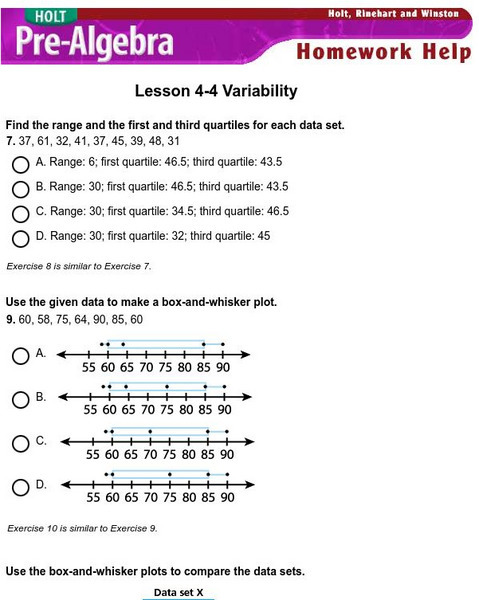
Get independent practice working with variability. Each incorrect response gets a text box explanation and another try. Correct responses are confirmed.
Other
Stat Soft: Statistics Glossary
Dozens of statistical terms are defined and illustrated in this glossary.


