Curated OER
Sports Teams & Math
Students collect sports data, keep track of wiins, losses and scores and average the teams' scores.
Curated OER
Height versus Shoe Size
Middle schoolers find a correlation between a person's height and his/her shoe size. They have access to entering data into lists on a graphing calculator and can complete scatter plots. Students read and interpret a scatter plot and use...
Alabama Learning Exchange
I Know What You Did Last Summer: A Data Graphing Project
Young scholars participate in graphing data. In this graphing data lesson plan, students make a stem and leaf plot of their summer activities. Young scholars create numerous graphs on poster boards. Students discuss the differences...
Curated OER
Beary O'Mometer Learns About Careers In Meteorology
Students explore the field of meteorology. In this meteorology lesson, students explore weather-related careers as they research the field of study as well as various weather concepts. Students interview meteorologists, write business...
Curated OER
Make a Frequency Table and a Histogram for a Given Set of Data
In this data recording and data organization worksheet, learners create one frequency table and one histogram for a given list of data. Explanations and examples for frequency tables and histograms are given.
Curated OER
Exploring Data Sets and Statistics in Baseball
Learners explore the concept data sets. In this data sets lesson plan, students find the 5 number summaries for salaries of teachers and compare them with 5 number summaries of professional baseball players. Learners use box and...
Curated OER
How Oceans Affect Climate
Learners draw conclusions about how the ocean affects temperature. In this weather lesson, students use the Internet to gather data to help them come to a conclusion about how the climate in a certain region is directly affected by the...
Curated OER
Why We Need Sleep
Fifth graders track how much sleep they get and list reasons sleep is important. In this health and math lesson, 5th graders keep up with their sleep times for a week and make notes about how they feel each day prior to the lesson. The...
Curated OER
Water Cycle Bag
Young scholars enclose water in an airtight bag and leave it in a warm area to view the water cycle. In this water cycle lesson plan, students observe evaporation, condensation, and precipitation. They then discuss what they learned...
Curated OER
Convection and Wind
Students use water, beakers, hot plates, paper dots, and goggles to participate in a hands on activity where they see how a convection current creates wind. In this convection current lesson plan, students participate in a hands on...
Curated OER
Great Graphing
Students collect data, use a computer spreadsheet program to create various graphs, and compare the graphs. They state the findings of each graph in writing and decide which graph type best represents the data.
Curated OER
Paying for Crime
Learners participate in activties examining ratios and proportions. They use graphs to interpret data showing the government's budget for prisons. They present what they have learned to the class.
Curated OER
Dealing with Data
Seventh graders collect and analyze data. In the seventh grade data analysis lesson, 7th graders explore and/or create frequency tables, multiple bar graphs, circle graphs, pictographs, histograms, line plots, stem and leaf plots, and...
Curated OER
Polystyrene Containers
Students conduct experiments to determine the effectiveness of polystyrene containers at preventing heat loss. In this polymers lesson, students design an experiment to determine how effective Styrofoam burger containers are at...
Curated OER
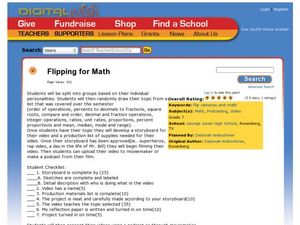
Flipping For Math
Seventh graders create a video of different formats to deliver a presentation of a math concept such as square roots, decimals, fractions, and more. In this math presentation lesson plan, 7th graders can plan a rap video, story,...
Curated OER
The Great Heat Escape
Students observe a demonstration on the role of thermal conductivity in heat transfer. For this thermal conductivity lesson, students design and conduct an experiment to compare the thermal conductivity of four substances. Lesson...
Curated OER
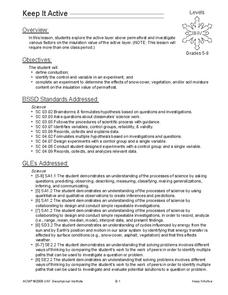
Keep it Active
Students explore the active layer above permafrost and investigate various factors on the insulation value of the active layer. In this energy transfer lesson plan, students conduct and experiment to determine the effects of snow cover,...
Curated OER
Infusing Equity Gender into the Classroom
Students investigate if gender makes a difference in the classroom. For this statistics lesson, students collect data on whether equity by gender in the classroom makes students more successful.
Curated OER
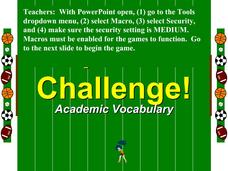
Academic Vocabulary: Sports Challenge
This PowerPoint enables students to review mathematical terms in an interactive review game format. The slides contain a question about a mathematical term and the students must answer with the correct vocabulary word in order to get...
Curated OER
The Spectrum of a Star
Tenth graders identify stars based on their line spectra. In this astronomy lesson, 10th graders analyze spectrograph and determine the elements present in the star. They explain the relationship between temperature and star classes.
Curated OER
Listen to Your Heart
Sixth graders explore how exercise affects heart rate and use spreadsheets to record and analyze data.
Curated OER
Using Computer for Statistical Analysis
Pupils examine the use for spreadsheets in analyzing data. They make spreadsheets that display and calculate a given data set such as temperature change.
Curated OER
Graphing Data - Temperature
Seventh graders measure and record temperature over a given time period. They compare the recorded temperatures to the 40-year recorded normal average temperatures for the same area. Students display and interpret their findings in a graph.
Curated OER
Weather for Health
Ninth graders encounter various types of numerical information (represented in multiple ways), much of which is abstract and difficult to comprehend. In this lesson plan, 9th graders will convert given information into bar graphs. In the...
Other popular searches
- Mean Median Mode Range
- Mean, Median, Mode Range
- Mean, Median, Mode, Range
- Median Mode Range
- Mean Median Mode and Range
- Mean, Median, Mode, and Range
- Median Mode and Range
- Mean, Median, Mode and Range
- Median, Mode, Range
- Statistics Median Mode Range


