Curated OER
Practice Exam #03
In this math review worksheet, students complete problems including simplifying, rounding, decimals, fractions, and more. Students complete 19 problems.
Curated OER
Take A Chance Or Two
A two-part lesson immerses young statisticians in the concept of probability. On the first day, will conduct experiments with a two-colored coin and learn how to write probabilities as fractions, ratios, and percentages. In the second...
Curated OER
Hybrid Vehicles: Cut Pollution and Save Money
Students examine how driving a hybrid car can save money and cut down on pollution. In this hybrid vehicles lesson students complete an exercise that shows them how to work with proportions, percents, dimensional analysis and...
Curated OER
Batting the Unknown
Students use batting averages to provide a measure of a player's past success. They use Algebra to calculate required performance to improve the average. Students compare baseball batting statistics early in the season and late in the...
Curated OER
Maps
Students figure out the mileage from one state to another using a map. For this map lesson, students look at the scale factor and turn it into a fraction. They measure the distance between two cities and use the proportion to find the...
Curated OER
Probability: How Likely Am I to...?
Twelfth graders examine various ways probability is applied to daily situations. They use marbles and blocks to calculate the probabilities of picking certain colors. They also calculate the odds of picking a winning raffle ticket.
Curated OER
Piece of the Sky: Introduction for Making S'COOL Observations
Students observe and discuss cloud cover. They identify percent of cloud cover, calculate cloud cover by fraction and convert to a percent, and compare their models with the current real sky cloud cover.
Curated OER
Prime Time Math
Seventh graders use educational software in order to practice lesson objectives. They define rate and ratio. Students solve distance problems given two variables. They also use a problem solving strategy that can be defended in its usage.
Curated OER
Code Breakers
Pupils collect data and make a frequency table, change ratios into percents, and analyze data to make predictions.
Curated OER
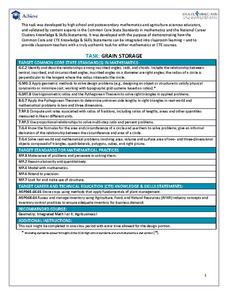
Task: Grain Storage
Farming is full of mathematics, and it provides numerous real-world examples for young mathematicians to study. Here, we look at a cylinder-shaped storage silo that has one flat side. Given certain dimensions, students need to determine...
Curated OER
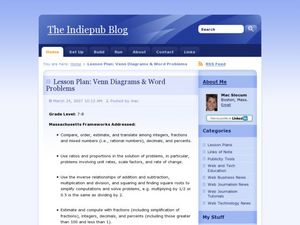
Venn Diagrams & Word Problems
Students explore the concept of Venn Diagrams through word problems. In this Venn Diagram lesson, students solve word problems about groups of people using Venn Diagrams. Students use survey results about MySpace and Facebook in a Venn...
Curated OER
“I Can” Common Core! 6th Grade Math
Help your sixth graders reach their Common Core math standards by providing them with a checklist of "I can" statements for each standard. As each concept is covered, kids can check it off, as long as they can do what it states.
Virginia Department of Education
Middle School Mathematics Vocabulary Word Wall Cards
Having a good working knowledge of math vocabulary is so important for learners as they progress through different levels of mathematical learning. Here is 125 pages worth of wonderfully constructed vocabulary and concept review cards....
Beacon Learning Center
Bowling Over the Order of Operations
Upper graders will solve equations using order of operations, and create equations that to play a fun math bowling game. They will bowl using dice to practice operations. Extensions are also included.
Curriculum Corner
7th Grade Math "I Can" Statement Posters
Translate the Common Core math standards into a series of achievable "I can" statements with this collection of classroom displays. Offering posters for each standard, this resource is a great way to support your seventh graders as...
EduGAINs
Making Savvy Consumer Choices
It's never too early to learn about grocery budgeting. Middle schoolers delve into the world of consumer math with a lesson that focuses on both healthy choices and real-world math applications. Groups work together to form a grocery...
Curated OER
Probability Lesson Plans
Here is an article on how teachers can use probability lesson plans to teach their charges about theoretical and experimental probability.
Curated OER
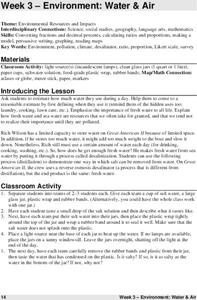
Environment: Water & Air
The introduction to the lesson mentions a sailor's limited capacity to store drinking water on his ship. Pupils then set up an overnight experiment to remove freshwater from salt water by distillation. There is a math and map activity to...
Curated OER
Numbers and Operations
Middle schoolers practice using proportions to discover the fraction needed to use the right amount of an ingredient. They calculate the number of ounces in one gallon as well. They answer questions to complete the lesson.
Curated OER
How Fast Is Your Car?
Eighth graders discover the relationship between speed, distance, and time. They calculate speed and represent their data graphically. They, in groups, design a ramp for their matchbox car. The goal is to see who's ramp produces the...
Curated OER
Who Wants to Carry a Million?
Students, in groups, determine the volume of a box large enough to hold a million dollars. They calculate the dimensions of a bill and the volume of the money.
Curated OER
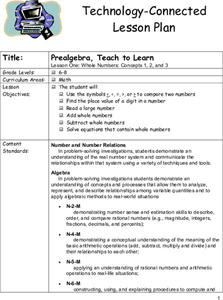
Whole Numbers
Student are assigned one of the sections on whole numbers. After reviewing the content, they teach their assigned sections to other class mates. They publish their findings on a PowerPoint slide show to use when they teach their section.
Alabama Learning Exchange
Scaling Down the Solar System
Learners work collaboratively to gain a better understanding of the vastness of space by scaling down the solar system. They measure by inches, gain an understanding of space, and model the distances of the planets from the sun.
Curated OER
Graph a Panther's Diet
Students examine the diet of panthers. In this interpreting data lesson, students collect data on the panther's diet and chart the data in bar and pie graphs.


