Curated OER
Show Me!
Young scholars analyze and interpret graphs. In this graphing lesson, students view a video and construct their own graphs (line, circle, bar) from given sets of data.
Curated OER
Calories
Learners explore calories. In this instructional activity about calories, students practice counting and recording calories. Learners use a sample Calorie Calculation Chart to record how many calories consumed in one day. Students do an...
National Center for Ecological Analysis and Synthesis, University of California Santa Barbara
Ucsb / Pie Graphs (Piece of Cake)
This page gives an example and easy-to-understand description of a pie graph (circle graph.) Also provides an opportunity for students to test their abilities to read a pie graph.
Texas Education Agency
Texas Gateway: Analyze Graphical Sources: Practice 2 (English I Reading)
This lesson focuses on practice exercises to understand and interpret the data in a graphic representations including pie charts, bar graphs, and line graphs.
Primary Resources
Primary Resources: Line Graphs and Pie Charts
Here are a few resources to use with your students when teaching about line graphs or pie charts.
Texas Education Agency
Texas Gateway: Analyze Graphical Sources: Practice 2 (English I Reading)
You will look at each of these types of graphs: bar graph, line graph, pie charts, as you work your way through the lesson.
The Math League
The Math League: Using Data and Statistics: Pie Charts
This introductory tutorial about statistical graphing with four examples of how pie charts (circle graphs) are constructed and read.
ClassFlow
Class Flow: Pie Charts Handling Data
[Free Registration/Login Required] Students read and interpret information presented in a pie chart and then determine percentages and ratios numerically and graphically.
Colorado State University
Colorado State Writing Center: Charts
The use of charts and graphs can improve your presentations, whether on paper or as visual aids. Here you can read about how to create line, column, bar, pie graphs, and scatterplots. Just follow the links to their respective pages.
Education Development Center
Tune in to Learning: Reading Charts and Graphs
Practice graph reading skills with these exercises and companion tutorials.
American Museum of Natural History
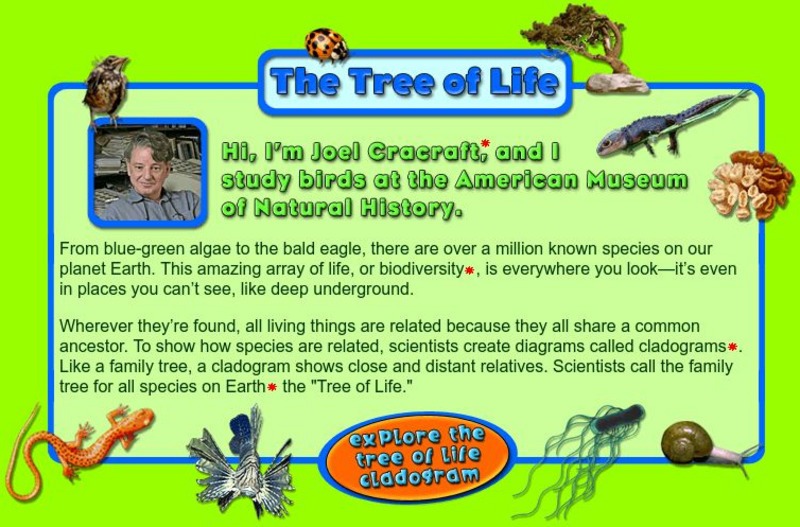
American Museum of Natural History: O Logy: The Tree of Life
Learn about the diversity of species on Earth by exploring a cladogram, a graph-like tree of life that illustrates relatedness among species. Includes instructions for reading cladograms and a pie chart that summarizes the percentages of...
ClassFlow
Class Flow: Reading Circle Graphs
[Free Registration/Login Required] Students are asked to figure out the size of the shaded portions of a circle graph. They then complete a chart showing the fraction, decimal, and percentage equivalents.
Texas Education Agency
Texas Gateway: Evaluate Graphics in Informational/procedural Text
[Accessible by TX Educators. Free Registration/Login Required] In this lesson, you will learn to explain the function of the graphical components. You will also learn to evaluate graphics on how well they do what they are intended to do.
McGraw Hill
Glencoe: Self Check Quizzes 1 Circle Graphs
Use Glencoe's randomly generated self-checking quiz to test your knowledge of circle graphs. Each question has a "Hint" link to help. Choose the correct answer for each problem. At the bottom of the page click the "Check It" button and...


