Curated OER
Scavenger Hunt
Students search for items in various parts of the newspaper noting the different types of information it provides.
Curated OER
Aruba Cloud Cover Measured by Satellite
Students analyze cloud cover over Aruba. They compose and submit written conclusions which include data, analysis, errors in data collection, and references.
Curated OER
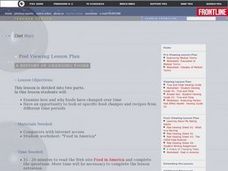
A History of Changing Foods
Students conduct Internet research to determine how food preparation and recipes have changed over time. They trace a favorite food through time, complete a worksheet and compare diets from different eras.
Curated OER
Houghton Mifflin Social Studies/Chapter 12, Lesson 1 A Struggle for Rights (pp. 270-274)
Fourth graders examine the time period of the 1960's and 70's to have discussions about three different ethnic groups. They examine the issue of discrimination and civil rights. The lesson includes a helpful outline with a hyperlink.
Curated OER
Kidsville USA
Second graders create an imaginary town using Kid Pix. They demonstrate their knowledge of specific vocabulary words and their knowledge and understanding of location by placing schools, stores, parks, etc. appropriately on their maps.
Curated OER
The Study of the Spanish-Speaking People of Texas: Understanding Primary Sources
Students analyze Russell Lee's photo essay as a sign of segregation in Texas. They consider the differences between primary and secondary sources and how historians use these sources.
Curated OER
Charlotte's Web Venn Diagram
Students, together as a class, construct a Venn diagram of characteristics they see in two classmates. Then, they independently create another Venn diagram comparing/contrasting two characters from the story Charlotte's Web. They share...
Curated OER
Saving An Endangered Species
Second graders work in groups in order to look at specific internet sites for animal adoption and sponsorship. They select an endangered species, determine needed funds, develop, advertise, and carry out a fund-raising plan.
Curated OER
Life During the Industrial Revolution
Seventh graders present information about the Industrial Revolution. In this Industrial Revolution lesson, 7th graders work in groups research inventions and prepare an information poster for the invention. Students present their poster.
Curated OER
Instructional Software Resources for Grades K-3
Learners become familiar with teh selection, evaluation, and use of instructional software for 4-8 classroom. They download software demos from the web and discuss critiquing software. Students browse software evaluations on web sites.
Education Development Center
Tune in to Learning: Reading Charts and Graphs
Practice graph reading skills with these exercises and companion tutorials.
Quia
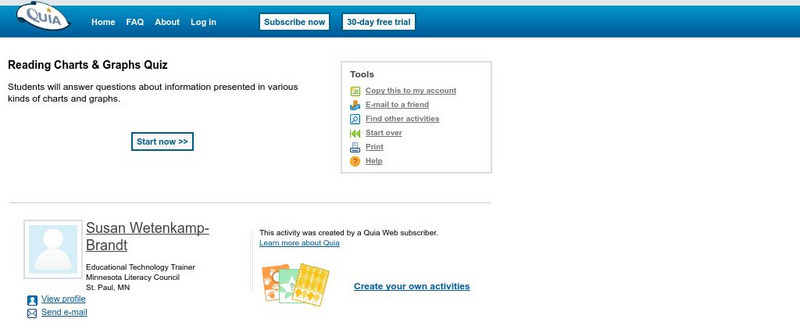
Quia: Reading Charts and Graphs Quiz
This 25-question quiz asks students to read various kinds of charts and graphs and to select the correct answers to the questions. Immediate feedback is provided after each question. Java is required.
Texas Education Agency
Texas Gateway: Informational Text: Synthesize Information in Charts and Graphs
In this lesson, you will learn how to understand the data found in charts and graphs, and at the end of the lesson, you will practice what you have learned.
Texas Education Agency
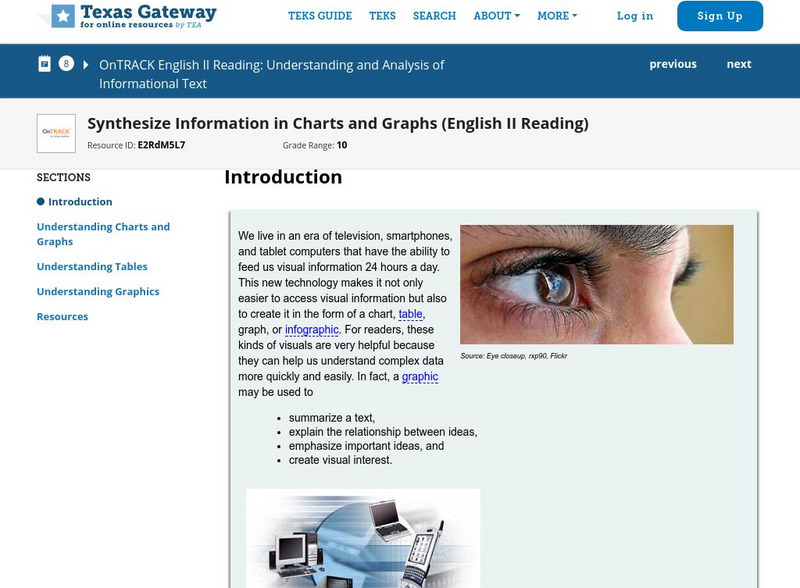
Texas Gateway: Synthesize Information in Charts and Graphs (English Ii Reading)
Synthesize information that you find in charts and graphs.
Texas Education Agency
Texas Gateway: Synthesize Information in Charts and Graphs (English Ii Reading)
Synthesize information that you find in charts and graphs.
Texas Education Agency
Texas Gateway: Analyze Graphical Sources: Practice 2 (English I Reading)
This lesson focuses on practice exercises to understand and interpret the data in a graphic representations including pie charts, bar graphs, and line graphs.
Lumen Learning
Lumen: Critical Reading: Specialized Reading Strategies
This lesson focuses on specialized reading strategies such as online reading, reading in math, science, etc., and reading charts and graphs. It provides text, videos, charts and graphs, graphics, and a self-check.
Other
The Topic: Charts and Graphs
Brief descriptions of charts and graphs, followed by links to larger sites on the same subject.
Grammarly
Grammarly Handbook: Visuals: Graphs, Charts, and Diagrams
This article explains that graphs, charts, and diagrams are used to display information visually. The choice of what type of graph or chart to use depends on the information to be displayed. Software programs make these much easier to...
National Center for Ecological Analysis and Synthesis, University of California Santa Barbara
Ucsb / Pie Graphs (Piece of Cake)
This page gives an example and easy-to-understand description of a pie graph (circle graph.) Also provides an opportunity for students to test their abilities to read a pie graph.
Texas Education Agency
Texas Gateway: Evaluating Data in Tables, Graphs and Charts
[Accessible by TX Educators. Free Registration/Login Required] In this lesson students look at examples of graphics, tables, charts, and graphs, and learn how to interpret their data. They will be able to use this skill to enhance their...
Khan Academy
Khan Academy: Read Histograms
Practice reading and interpreting histograms. Students receive immediate feedback and have the opportunity to try questions repeatedly, watch a video or receive hints.
Texas Education Agency
Texas Gateway: Analyze Graphical Sources: Practice 2 (English Ii Reading)
[Accessible by TX Educators. Free Registration/Login Required] Analyze the factual, quantitative, and technical data in graphs and charts.
Khan Academy
Khan Academy: Reading Dot Plots & Frequency Tables
Practice reading basic dot plots and frequency tables. Students receive immediate feedback and have the opportunity to try questions repeatedly, watch a video or receive hints.


