Read Works
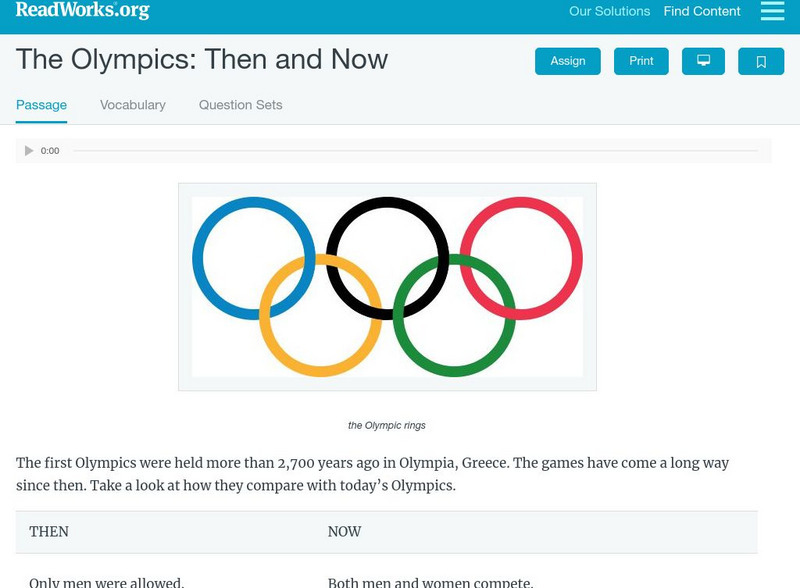
Read Works: The Olympics Then and Now
[Free Registration/Login Required] Students read two charts with information about the Olympics in ancient Greece and in modern times. A question sheet is available to help students build skills in comparing and contrasting.
California State University
Reading Strategies From the University of Waterloo
Brief and easy to read, this California State University Northridge site lists strategies for getting the most of your reading. Geared for reading texts and technical material.
Read Works
Read Works: The Middle Ages Feudalism in the Middle Ages
[Free Registration/Login Required] An informational text about feudalism and how it provided stability during the Middle Ages. A question sheet is available to help students build skills in reading comprehension.
McGraw Hill
Glencoe: Self Check Quizzes 1 Circle Graphs
Use Glencoe's randomly generated self-checking quiz to test your knowledge of circle graphs. Each question has a "Hint" link to help. Choose the correct answer for each problem. At the bottom of the page click the "Check It" button and...
The Math League
The Math League: Using Data and Statistics: Pie Charts
This introductory tutorial about statistical graphing with four examples of how pie charts (circle graphs) are constructed and read.
Khan Academy
Khan Academy: The Sat Reading Test: Overview
This is an overview of what to expect on the SAT Reading Test. It assesses your ability to read and interpret a variety of texts similar to the reading you will find in college and your career. All of the questions on the reading test...
Texas Education Agency
Texas Gateway: Analyze Graphical Sources: Practice 2 (English I Reading)
You will look at each of these types of graphs: bar graph, line graph, pie charts, as you work your way through the lesson.
Colorado State University
Colorado State Writing Center: Charts
The use of charts and graphs can improve your presentations, whether on paper or as visual aids. Here you can read about how to create line, column, bar, pie graphs, and scatterplots. Just follow the links to their respective pages.
Texas A&M University
Wtamu Virtual Math Lab: Beginning Algebra: Reading Graphs
A good introduction to reading bar, line, and double line graphs, and drawing and reading Venn diagrams. Contains definitions and examples of these types of charts and graphs as well as practice exercises that ask you to answer questions...
Other
Super Teacher Worksheets: Reading Comprehension: Hurricanes [Pdf]
Read the fifth-grade reading passages and charts about hurricanes by Erin Ryan and answer the comprehension questions over the selections. PDF includes an answer key with explanations.
Read Works
Read Works:north America:comparing Data From Different Countries Around the World
[Free Registration/Login Required] A chart with land and population data from Canada, the United States of America, the United Kingdom, and Japan. A question sheet is available to help students build skills in reading comprehension.
Read Works
Read Works: Animal Ears
[Free Registration/Login Required] An informational text about four animals that have very different types of ears. A question sheet is available to help students build skills in reading comprehension.
Read Works
Read Works: Ride of the Century
[Free Registration/Login Required] Students read about the 100th birthday of New York City's subway system. A question sheet is available to help students build skills in classifying and categorizing.
Utah Education Network
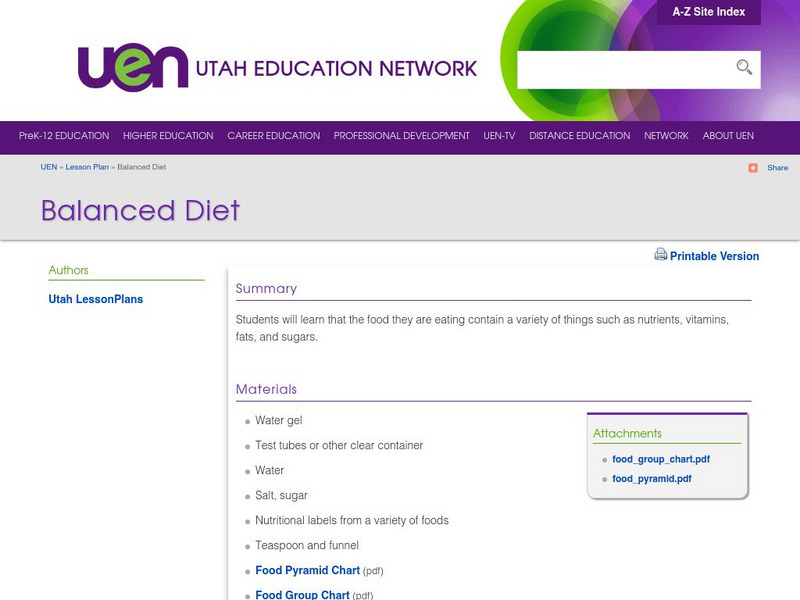
Uen: Balanced Diet
In this instructional activity, 2nd graders will learn about the components of a balanced diet. Students will analyze charts and then self-report their own foods in categories. Several fiction and nonfiction books are listed as...
Other
Kim's Korner: Graphic Organizers for Writing and Reading
What are graphic organizers for reading and writing? Use this site to learn more about these learning tools.
Primary Resources
Primary Resources: Line Graphs and Pie Charts
Here are a few resources to use with your students when teaching about line graphs or pie charts.
Read Works
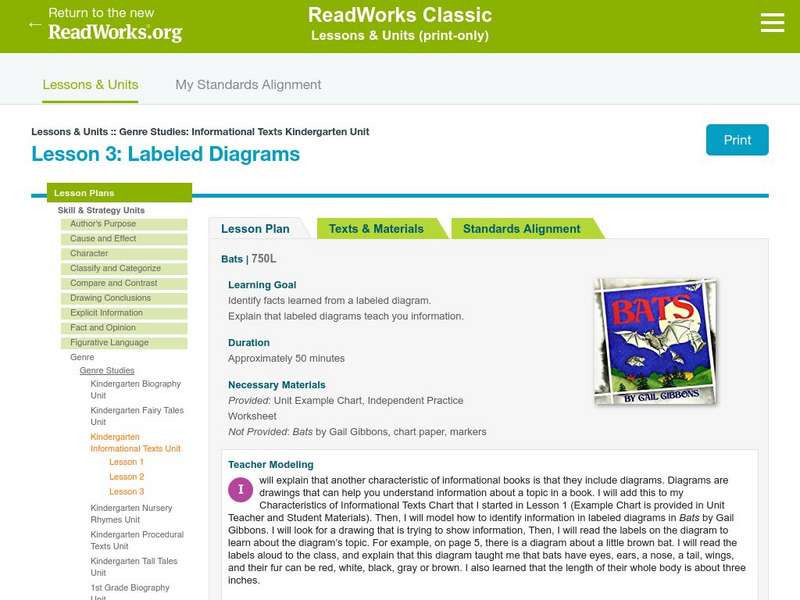
Read Works: Genre Studies: Informational Text Kindergarten Unit: Labeled Diagrams
[Free Registration/Login Required] Lesson uses Bats by Gail Gibbons to teach students how to identify facts learned from labeled diagrams within an informational text. Ideas for direct teaching, guided practice, and independent practice...
English Zone
English Zone: Chart Reading Practice 1
Practice reading and understanding information when it is provided in chart format. This website provides a simple chart and asks questions about the chart's information, which can be answered and checked.
Texas Education Agency
Texas Gateway: Analyze Graphical Sources: Practice 2 (English I Reading)
Analyze the factual, quantitative, and technical data in graphs and charts.
Concord Consortium
Concord Consortium: Stem Resources: Describing Velocity
An interactive module where students record their ideas in response to questions, and read and manipulate graphs and charts while they learn about velocity-time graphs and position-time graphs.
Florida Center for Reading Research
Florida Center for Reading Research: Essentials for Reading Success
This site offers three cyclical flow charts of the essentials for reading success: components of reading, types of assessment, and layers of instruction.
Florida Center for Reading Research
Florida Center for Reading Research: Exp. Text Structure: Text Feature Find
A lesson plan in which students look through a book to find various text features including: a table of contents, sequence and format, charts/graphs/maps, diagrams/graphics/illustrations, print variations, an index, and a glossary....
ClassFlow
Class Flow: Reading Circle Graphs
[Free Registration/Login Required] Students are asked to figure out the size of the shaded portions of a circle graph. They then complete a chart showing the fraction, decimal, and percentage equivalents.
University of Texas
Inside Mathematics: Parking Cars [Pdf]
This task challenges a student to use their understanding of scale to read and interpret data in a bar graph.


