Curated OER
Unit 2 Sun & Stars
Young scholars describe stellar objects using terms such as stars, planets, satellites, orbits and light. In this sun and stars unit, students research stellar objects through seven individual lessons discovering star characteristics,...
Curated OER
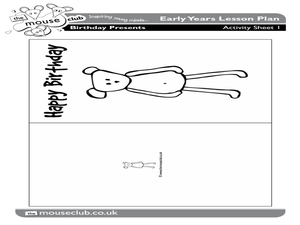
Birthday Presents: How to Give and Receive
Students discuss giving and receiving presents at a birthday party. In this social skills lesson, students practice using manners when giving and receiving gifts. This lesson also has other interdisciplinary activities that can be used...
Curated OER
China
Second graders complete a variety of activities surrounding a unit on China and Chinese culture.
Curated OER
Putting it all Together
Students take notes and summarize information. In this communication lesson, students summarize information by taking notes using the various methods that their instructor presents to them.
Curated OER
Up From The Roots
Students review prefixes and root words then complete a Root Words worksheet. An answer sheet is provided with the lesson plan.
Curated OER
High and Low Tides
Students collect real world data from the Web regarding high and low tides at various locations in the United States. They find a function which models this data and make predictions on tide levels based on the information found.
Curated OER
Tree-mendous Trees
Students become aware of the importance of trees in the natural world. Students are shown 2 filmstrips - Special Things About Trees and Tree Magic. Students plants seeds. They, students predict the growing chart of tree growth. Students...
Curated OER
Technology has a Solution!
In this technology worksheet, students summarize four things they learned about technology and the environment. Students then write a report that outlines how technology is solving environmental issues.
Curated OER
A Look at the Life That Electronics Lead
In this comprehension worksheet, learners fill in ways on a graphic organizer that people or companies can conserve energy, reduce waste or minimize the impact to the environment. Next, students solve 3 "environmental" math word problems.
Curated OER
Introduction to Graphical Representation of Data Sets in Connection with Nuclear Decay
Students record data, make observations, and share in experimentation and discussion of numerical experiments.
Curated OER
A Bird's Eye View of our 50 States
Third graders focus on state birds as they learned absolute location (latitude/longitude) of each state, as well as their relative location (bordering states).
McGraw Hill
Glencoe: Self Check Quizzes 1 Circle Graphs
Use Glencoe's randomly generated self-checking quiz to test your knowledge of circle graphs. Each question has a "Hint" link to help. Choose the correct answer for each problem. At the bottom of the page click the "Check It" button and...
CK-12 Foundation
Ck 12: Statistics: Interpretation of Circle Graphs Grades 6 7
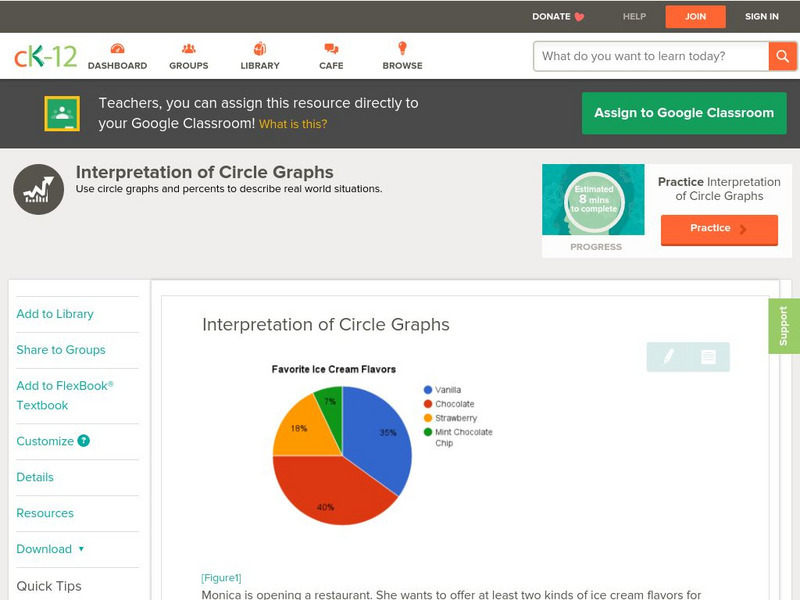
[Free Registration/Login may be required to access all resource tools.] Read and interpret circle graphs.
ClassFlow
Class Flow: Reading Circle Graphs
[Free Registration/Login Required] Students are asked to figure out the size of the shaded portions of a circle graph. They then complete a chart showing the fraction, decimal, and percentage equivalents.
National Center for Ecological Analysis and Synthesis, University of California Santa Barbara
Ucsb / Pie Graphs (Piece of Cake)
This page gives an example and easy-to-understand description of a pie graph (circle graph.) Also provides an opportunity for students to test their abilities to read a pie graph.
Texas Education Agency
Texas Gateway: Analyze Graphical Sources: Practice 2 (English I Reading)
You will look at each of these types of graphs: bar graph, line graph, pie charts, as you work your way through the lesson.
Primary Resources
Primary Resources: Line Graphs and Pie Charts
Here are a few resources to use with your students when teaching about line graphs or pie charts.
The Math League
The Math League: Using Data and Statistics: Pie Charts
This introductory tutorial about statistical graphing with four examples of how pie charts (circle graphs) are constructed and read.


