Curated OER
Graph it!
Sixth graders view a Stacked Graph, and discuss what it shows. Students discuss the basics of graphing: labels, intervals, legends x and y axis... Students create individual stacked graphs from provided information. Students view a...
Curated OER
Get the Picture with Graphs
Fifth graders examine line, bar and circle graphs in the newspaper and on the Internet. They complete sketches of graphs with an emphasis on selecting the best model to depict the data collected.
Columbus City Schools
Speed Racers
Who wants to go fast? The answer? Your sixth-grade science superstars! The complete resource offers the ultimate, all-inclusive playbook for mastering the important concepts of speed versus time; distance versus time; and how to graph...
Curated OER
Graphing with Stems-and -Leafs
Fourth graders examine the use of stem and leaf graphs. For this stem and leaf graph lesson, 4th graders participate in teacher led lesson showing the use of the graphs. They work in groups to collect data about peanuts before making a...
Curated OER
Speed
Fifth and sixth graders practice working in pairs to determine whether they can walk with constant speed. They test themselves, collect their data, draw graphs with their data collected, manipulate the data, and then draw conclusions...
Curated OER
Graphing Using Cookies
Students differentiate between bar graphs, line graphs, pictographs and bar graphs. After participating in a hands-on cookie activity, students label and draw their own graphs.
Curated OER
Math Handbook: Trigonometry
You'll be spinning in unit circles once you read through this jumbo-sized resource of everything you need to know about trigonometry. Each page has color-coded examples with explicit directions that detail the problems and formulas.
CPO Science
Physics Skill and Practice Worksheets
Stop wasting energy searching for physics resources, this comprehensive collection of worksheets has you covered. Starting with introductions to the scientific method, dimensional analysis, and graphing data, these skills practice...
Curated OER
My Test Book: Reading Pie Charts
In this math skills worksheet, students solve 9 multiple choice math problems that require them to read and interpret charts. Students may view the correct answers.
Curated OER
Deciding Which Type of Graph is Appropriate
In this graphing instructional activity, students read about line, bar, and pie graphs and then determine which graph is the best way to express data results. This instructional activity has 3 short answer questions.
K12 Reader
Where On Earth Are You?
What do we use to determine the exact locations on the earth? Your kids can learn all about compass roses and latitude and longitude. Test understanding with the five reading comprehension questions included on the page.
Curated OER
Graphs, Stories, And Games
In this graphs lesson, students read stories and present story situations on a graph. They explore distance and diameter and explain graphs. Students create their own stories to fit graphs.
Curated OER
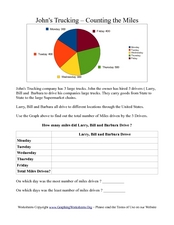
John's Trucking- Counting the Miles
In this graphs worksheet, students analyze a pie graph showing miles driven by three truck drivers in a week. Students fill out a chart in which they calculate total miles driven.
Curated OER
Fairy Tales
Sixth graders explore the elements of fairy tales. In this fairy tales lesson, 6th graders analyze several versions of Cinderella from around the world. Students graph fairy tale elements using Excel and create Venn diagrams comparing...
Curated OER
Reading and Making Pie Graphs
In this pie graphs worksheet, students solve 10 different problems that include reading a pie graph. First, they use the pie graph to respond to 5 questions that follow. Students determine the year that had the smallest and largest...
Los Angeles County Office of Education
Assessment for the California Mathematics Standards Grade 2
Test scholars mathematic skills with an assessment addressing addition, subtraction, multiplication, place value, measurement, geometric shapes, expanded notation; and their ability to compare numbers, write number sentences, draw...
CK-12 Foundation
CK-12 Middle School Math Concepts - Grade 6
Twelve chapters cover a multitude of math concepts found in the Common Core standards for sixth grade. Each title provides a brief explanation of what you will find inside the chapter—concepts from which you can click on and learn more...
Curated OER
The Economienda System
Explore the Economienda System common in Latin America during the 1700s. The class will read the included text, answer 3 critical-thinking questions, and fill out a pie chart showing the demographics of the time. They will learn about...
Curated OER
Graphing Data Brings Understanding
Students collect, graph and analyze data. In this statistics lesson, students use circle, pie, bar and lines to represent data. They analyze the data and make predictions bases on the scatter plots created.
Curated OER
Picture Graphs
First graders work with picture graphs, create their own individual graphs, and construct and read graphs.
Curated OER
The Unit Circle
Students relate the trigonometric functions to the coordinates of the unit circle with access to explorelearning.com. They determine the signs of trigonometric functions in each quadrant.
Curated OER
Every Graph Tells A Story
Seventh graders explore linear equations. In this graphing lesson, 7th graders explore constant rates of change. Students discover the real-life application of graphs and demonstrate their ability to read graphs and write corresponding...
Curated OER
Graphs of Formulas
In this worksheet students fill out a function table after reading a short word problem. This is a good way for students to practice the necessary skills for solving word problems or setting up algebra equations.
Curated OER
Graphs: All About Our Class
Students respond to survey questions, discuss results, brainstorm ways to represent survey information, and create table of class results. They find mean, range, and percentages, and create graph to display results.


