Curated OER
Death by Particles
Emerging epidemiologists define relative risk and read an article about the effect of particulate pollution on the cardiovascular health of women. They record the relative risk values, graph them, and answer analysis questions. This is a...
Curated OER
Telecommunications and the Whole Language Program
Young writers use technology and other media to research information on a chosen topic. They explore countries where keypals and e-mail friends are located. Using their writing skills, they correspond with their e-mail friend and...
Math Stars
Math Stars: A Problem-Solving Newsletter Grade 6
Think, question, brainstorm, and make your way through a newsletter full of puzzles and word problems. The resource includes 10 different newsletters, all with interesting problems, to give class members an out-of-the box...
Curated OER
Math Made Easy
Students evaluate word problems. For this problem solving lesson, students are presented with word problems requiring graphing skills and students work independently to solve.
Curated OER
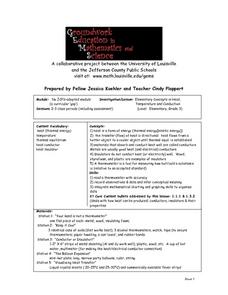
Elementary Concepts in Heat
Third graders read a thermometer with accuracy, record observations and data, and infer conceptual meaning. They integrate mathematical charting and graphing skills to organize their data. They explore what happens when they touch or use...
Curated OER
Graphing Family Reading Habits
Second graders collect data from their families about their reading habits and graph them. In this graphing family reading habits lesson, 2nd graders interview family members about their reading habits. They then use a graphing computer...
Curated OER
Coordinate Graphing
Students practice basic coordinate graphing and plotting points on the coordinate axis. In this geometry lesson, students are introduced to ordered pairs, and the x and y axis.
Curated OER
Graphing Favorite Holidays
Pupils create spreadsheets and bar graphs based on results of survey of favorite holidays.
Curated OER
Tips for Studying History
In this historical analysis activity, students read the 6 tips for studying historical time periods and then read a 1-paragraph selection about the Chinese approach to history and respond to 3 short answer questions.
Curated OER
Have Respect
Students learn the value of respect. In this Clifford the Big Red Dog lesson plan, students read the story, discuss respect, and experience a mini-international festival.
Curated OER
Be a Good Friend
Students discover characteristics of a good friend. In this social skills lesson, students read Clifford's Manners and discuss ways Clifford used his manners in the story. An activity that rewards students for modeling being courteous...
Curated OER
All in the Family
Students use data to make a tally chart and a line plot. They find the maximum, minimum, range, median, and mode of the data. Following the video portion of the lesson, students will visit a Web site to test their data collection skills...
Curated OER
Comparing Temperatures and Latitudes
Eighth graders collect weather data from a variety of cities at the same latitudes, but on different continents. They organize data using spreadsheet program, generate graphs, and incorporate into a word processing document. Students...
Brigham Young University
K-W-H-L for Harry Potter and the Chamber of Secrets
To prepare for a study of Harry Potter and the Chamber of Secrets, the second in the series of seven books about J.K. Rowling's amazing young wizard, readers complete a K-W-H-L chart.
Curated OER
Elements of a Story - Plot, Characters, and Setting
Use this SMART board activity with any short story in your unit plan. The SMART board file contains a step-by-step guide to plot diagrams, including an interactive practice page and an assignment. This resource is beneficial for language...
EngageNY
Graphs of Linear Functions and Rate of Change
Discover an important property of linear functions. Learners use the slope formula to calculate the rates of change of linear functions. They find that linear functions have constant rates of change and use this property to determine if...
Miami University
Chapter Nine Worksheet: Monopoly
Advanced economics pupils analyze a series of graphs, data sets, and profit scenarios all related to monopolies and marginal revenue. They read through the background information, complete a graph using the data provided, and justify...
Curated OER
Greeks Around the World: A Case Study on Greek Diaspora
Students gain an understanding of the concept of Diaspora relating to Greeks. They use guided discovery to apply the geographic inquiry model to an examination of the reasons for Greek Diaspora.
Carolina K-12
Battle Behind the Pumps
After considering the role that gasoline plays in our lives and our dependence on it as a society, learners participate in a reading activity discussing why oil prices are increasing. They will then simulate being members of a committee...
McGraw Hill
Binary Stars Interactive
A celestial body's distance from Earth makes studying its characteristics much more difficult. Learn how scientists use indirect measures to determine the size of stars. The interactive activity has individuals adjust the size of binary...
Centers for Disease Control and Prevention
Major Disparities in Adult Cigarette Smoking Exist Among and Within Racial and Ethnic Groups
Data indicates that some racial groups smoke more than others, and that with that racial group, there are smaller groups whose smoking habits vary as well. Secondary learners read a graph that details the differences between the Asian...
Encyclopedia Britannica
Do the Campaign Math
Follow the money trail! As part of their study of the 2020 Presidential campaign, class members to research how much money candidates have raise and spent, as well as the sources of the funds. They then graph their findings to compare...
Curated OER
Graphing With RXTE
Students use data from the Rossi X-ray Tiiming Explorer (RXTE) satellite to analyze and graph.
Curated OER
Show Me!
Learners analyze and interpret graphs. In this graphing instructional activity, students view a video and construct their own graphs (line, circle, bar) from given sets of data.


