Serendip
Changing Biological Communities – Disturbance and Succession
After cutting down a forest to make a farm, how long would it take the environment to turn an abandoned farm back into a forest? Scholars study this exact scenario while they interpret many charts and graphs of the changing ecosystems as...
Curated OER
Understanding Growth of the Phoenix Area
Students study the growth of the Phoenix area using geographic images, maps, tables, and graphs. They study the idea of community.
EngageNY
Discovering the Topic: Inferring and Confirming Using Evidence
Allow your class to figure out what they will be studying through an inquiry-based anticipatory set that involves analysis of mystery documents and practice with making inferences. The lesson plan document includes a detailed description...
Physics Classroom
From a Feather to an Elephant
It is always a rush to drop objects from great heights, and with this physics experiment, class members will not be disappointed! They drop a single coffee filter from a balcony or table top, record the time it takes to reach the ground,...
Physics Classroom
Action-Reaction Lab
Computer-interfaced motion detectors are required to carry out this inquiry. It is a new twist on exploring motion with plunger carts: they are set back-to-back and then propelled away from each other. Their velocities are measured, and...
Virginia Department of Education
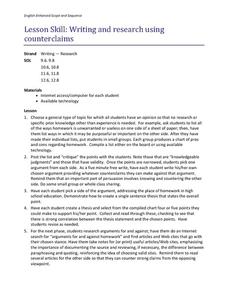
Writing and Research Using Counterclaims
Introduce your high school scholars as to how to use counterclaims in argument writing. Learners explore this skill with collaborative efforts and technology. Together they explore the pros and cons of homework and develop a thesis for...
Delegation of the European Union to the United States
The Geography of Europe
What is the European Union? Where is it? Why is it? To begin a study of the EU, class members examine the physical geography of Europe and the size and population density of 28-member countries in comparison to non-member countries like...
PHET
Radiation Hazards in Space
Young scientists race from Earth to Mars and back, trying to complete mission objectives while avoiding radiation in this game for 2-4 players. To identify the winner, players must graph their mission points and radiation points at the...
Curated OER
Protocol for Backyard Bird Research Project
Young scholars investigate a hypothesis about birds in their backyard using identification and survey skills.
Curated OER
Perceived Risks
Learners rank a list of everyday risks to compare with classmates. They rate each risk on both its ability to be controlled and its observability in the environment. Results are graphed.
Alabama Learning Exchange
The Water Cycle
Learners identify the stages of the water cycle. They listen to the book "Magic School Bus: Wet All Over," examine the Build Your Own Water Cycle website, predict and measure the amount of water in a jar for a week, and read a short play...
Curated OER
Nutrition: A Thematic Unit
Young learners explore nutrition and the food groups in these two mini-lesson plan ideas. First, kindergarteners have a discussion about their health and how different foods contribute to it before making their own personal food pyramid....
Reardon Problem Solving Gifts
Teaching Problem Solving Strategies in the 5-12 Curriculum
Address any kind of math concept or problem with a series of problem-solving strategies. Over 12 days of different activities and increasing skills, learners practice different ways to solve problems, check their answers, and reflect...
Virginia Department of Education
Predator-Prey Simulation
Do your pupils have the misconception that environmental predators are "bad" and harm smaller creatures? The simulation explains, in detail, the important role predators play in maintaining a stable ecosystem. Through web-based research,...
Science 4 Inquiry
The Yin and Yang of Photosynthesis: Day vs. Night
Floating fragments of elodea can grow even without roots. Young scientists use eldoea plants to observe the oxygen production from photosynthesis. They study the difference between having access to high amounts of light and low amounts...
Curated OER
Enhancing Writing Through Technology
Students participate in a class survey of their favorite activity to do in the snow and organize the results in a graph. They write a paragraph about the graph using language from a class-developed word web and include both an opening...
Curated OER
What's Your Favorite Planet?
Fourth graders interpret a graph and make correlations using data. After taking a class survey, 4th graders create a class graph of their favorite planets. Working in small groups, they interpret the information and create at least ten...
Curated OER
Introduction to Graphical Representation of Data Sets in Connection to Cellular Growth
Students practice graphing relationships between variables by studying topics such as exponential growth and decay. They conduct a series of numerical experiments using a computer model and a variety of physical experiments using mold,...
Curated OER
Apple Eaters
Students sample a variety of apples and graph group results for the class favorites. They orally explain the graph.
Curated OER
Bar Me In
Fourth graders watch a video about constructing bar graphs. They create their own graph and interpret it.
Curated OER
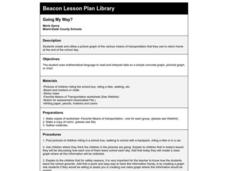
Going My Way?
Students discuss how each one of them leaves school each day. They create and analyze a class graph displaying the information collected.
Curated OER
Points in the Complex Plane -- Lab
Students review the lecture portion of this lesson. Individually, they graph various points on a complex plane and identify conjugates based on their location on the graphs. They complete a worksheet and review their answers to end the...
Curated OER
Education for Global Peace
Fifth graders construct data graphs based upon sets of data. In this graphing instructional activity, 5th graders read the text If the World Were a Village and discuss how types of graphs accurately represent a large population. Students...
Curated OER
The 400-Meters Race
Students collect and graph data. In this algebra lesson, students describe, interpret and analyze data. They follow a 400 meters race and plot the coordinates of the course. They graph a line to represent the data of the course.


