Curated OER
Science and Technology
Students research inventions that have been created. In this historical technology lesson, students read the Harcourt Brace social studies textbook and discuss how inventors used graphs to display data. Students create a table to write...
Curated OER
Interpreting Medical Data
Students explore human anatomy by graphing scientific data. In this vision lesson, students discuss how ophthalmology works and take their own eye assessment test using the Snellen chart. Students collect vision data from all of their...
Curated OER
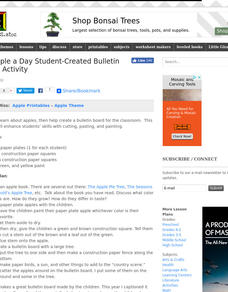
An Apple a Day
Students study apples and then paint apples whichever color is their favorite apple color. They help create a bulletin board for the classroom. They graph the different colors of apples found on the board.
Curated OER
What's The Weather?
Second graders record and summarize daily weather observations for a week in the form of a bar graph. They cut and glue a weather symbol for each day, record it on the graph, and answer discussion questions.
Curated OER
Baseball Math
Students collect data on baseball plays. In this statistics lesson, students graph their data and make predictions based on their observation. They calculate what the probability is that a favorable outcome would happen.
Curated OER
Weather Awareness
Second graders investigate weather. In this weather lesson, 2nd graders discover how to read a temperature gauge, keep track of the weather, and find out how the weather affects their day. They work individually and in partners to make...
Curated OER
Remembering the First
Young scholars examine words and phrases associated with World War I as an introduction the era. They explore the legacy of World War I by reading and discussing "The War to End All Wars If Only." Students write obituries for fallen...
Curated OER
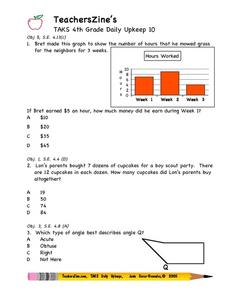
TAKS 4th Grade Daily Upkeep 10
In this math worksheet, 4th graders look for the answers to basic review problems that focus upon the skills of reading simple word problems, and applying the interpretation of data.
Curated OER
National Longitudinal Survey of Children and Youth (NLSCY)
Students review data analysis techniques. In this statistics lesson, students access statistical software regarding the National Longitudinal Survey of Children and Youth. Students read and interpret the data as they complete the...
Curated OER
Geography of South America
Students explore South America. In this geography skills lesson, students watch a video about the geographical features of the continent. Students complete worksheets on the topic.
Curated OER
The Study of the Spanish-Speaking People of Texas: Understanding Photo Essays
Students analyze a photo essay of the Spanish-Speaking People of Texas by the photojournalist Russell Lee. They identify the goals of the photo essay, explore a website, and complete a worksheet.
Curated OER
Red Tail Ridge Wetland Study Project
Fifth graders use a real life scenario of the wetlands to gather information on creatures of the habitat. In this wetlands lesson, 5th graders research the interdependence of organisms in a healthy habitat. Students collected samples...
Curated OER
Using Vegetation, Precipitation, and Surface Temperature to Study Climate Zones
Middle schoolers begin their examination of the climate zones found around the world. Using a software program, they identify the relationship between the vegetation, climate and temperatures of the different zones. They also plot...
Curated OER
Let's Discover Communities
Second graders compare and contrast the city and the country. After reading books about animals, 2nd graders create picture cards of animals in both the country and city environment. In partners, students draw pictures of animals,...
Curated OER
Graphing
Fifth graders create graphs based on climate in South Carolina. They read and interpret information in a chart and construct a graphy from the information in the chart. They create a spreadsheet using Excel and publish 2 graphs.
Curated OER
Forest Activity: Interpreting a Graph
Students research forest growth online. They analyze the parts and contents of a graph, then summarize in narrative form the changes in the forest over time.
Curated OER
Impossible Graphs
Students distinguish between possible and impossible graphs of functions, and to learn why some graphs are impossible. They have practiced plotting functions on the Cartesian coordinate plane
Curated OER
Graphing Current Drug Data
Students increase understanding of the drug issue and further develop skill in graphing.
Curated OER
Graph Your Foot!
Students measure their own foot and place the outline on a graph. They make connections between the size of their foot and the bar graph that represents it.
Curated OER
Graphs
Students list their favorite cars and create graphs of their favorites. Students determine how the graphs would change as their choices change.
Curated OER
Graphing: Ocean Floor
Students graph the ocean floor using given data. In this earth science instructional activity, students label different oceanic features on the map. They answer questions at the end of the lab.
Curated OER
The Classroom Desk Graph
Second graders choose the appropriate measuring tool by discussing a tool to measure contents in desks. They then use a scale to weigh contents in desks.
Next, they study standard units of measurement by writing down the weight in...
Curated OER
Creating and Analyzing Graphs of Tropospheric Ozone
Students create and analyze graphs using archived atmospheric data to compare the ozone levels of selected regions around the world.
Curated OER
The Classroom Desk Graph
Second graders discuss appropriate units of measure to use when weighing the contents of their desks. They use a scale to weigh different items from their desks. They write down weight in pounds and graph the results using an online...


