Curated OER
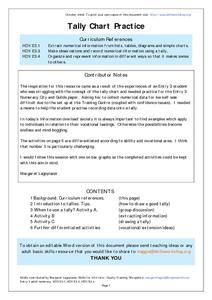
Tally Chart Practice
In this tally chart worksheet, students will read about tally charts and their uses. Students will make a list of when and why they could make a tally chart. Next students will complete a tally chart and write statements about the...
Curated OER
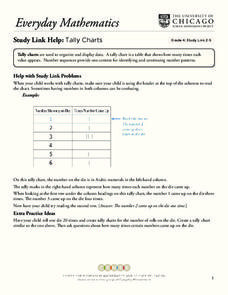
Tally Charts
In this tally charts learning exercise, students discuss how to use a tally chart and how to read the chart. Once students record information on a tally chart they answer questions showing their ability to read a tally chart.
Curated OER
Celebrating the Solstice and Equinox
Fourth graders graph the number of daylight hors throughout the year and examine why day length varies. They discover that seasonal changes and latitude on Earth affect the number of hours of daylight in each day. Students listen to...
Curated OER
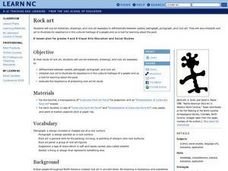
Rock art
Students study rock art they use art materials, colored photographs and rock art examples to: differentiate between symbol, petroglyph, pictograph, and rock art. They interpret rock art to illustrate its importance in the cultural...
Curated OER
Taming the Mighty Dragon
Students incorporate the five themes of geography to study the Yangtze river region. They analyze the possible effects of the three rivers gorge damn project on this area and role play a float the entire length of this dangerous river...
Curated OER
WORLD GEOGRAPHY
Students identify and analyze map symbols and map grids by completing various worksheets and creating their own map using these skills. Students identify and analyze what latitude and longitude are on a map to play a game of Bingo....
Curated OER
Country Locations
First graders read a story and locate where the countries in the story are located. In this traditions lesson, 1st graders explore food dishes from different countries and discuss where they are located. Students tell their favorite...
Curated OER
Bus Graph
Students make predictions about which bus takes the most/least students in the classroom. They use KidPix bus stamp for each student who goes home on that bus number and record data and discuss predictions.
Curated OER
Illuminating Climate Change: Connecting Lighting and Global Warming
Students analyze energy usage and connect energy usage to fossil fuel consumption. In this global warming and pollution lesson, students what fuels are used to generate electricity and how much CO2 each fuel produces, then graph the...
Florida Center for Reading Research
Phonological Awareness: Syllables, Syllable Say
Counting syllables can be fun when it's done with a friend. In pairs, learners say words as their partner counts the syllables they hear.
Curated OER
Nutrition and the Media: Cereal Box Consumerism
How many treats do you buy each week? Learners investigate diets and how the media tricks consumers into purchasing unhealthy snacks. They will investigate the designs and logos affiliated with cereal boxes and identify specific phrases...
National Geographic
Altitude: What's in the Air?
Introuduce your scientists to the differences in air at varying altitudes with a colorful explanatory graph. After some discussion, they view unbelievable footage of mountain-climbing Leo Houlding and a narrative about how he might do...
Curated OER
Pumpkin Pumpkin
Students study the very basics of pumpkins. By looking at where pumpkins grow, what they grow on, and what can be done with a pumpkin. They create a graphic organizer and then carve a pumpkin for Halloween.
Curated OER
Ornithology and Real World Science
Double click that mouse because you just found an amazing lesson! This cross-curricular Ornithology lesson incorporates literature, writing, reading informational text, data collection, scientific inquiry, Internet research, art, and...
Curated OER
Rolling with Links
First graders explore geometry by completing a worksheet in class. In this non-standard measurement unit lesson, 1st graders discuss different techniques for measuring items without the use of a ruler. Students read several short stories...
Illustrative Mathematics
Warming and Cooling
Is it too hot to go hiking? This task asks learners to refer to a graph that shows temperature as a function of time and answer five questions about the scenario depicted by the graph. The exercise could be used for instruction to help...
Curated OER
Finding Equations
Learners make equations from everyday data. They create a graph from the equations. Students predict and analyze the results. Learners complete the second scenario on their own and turn in their handout.
Curated OER
Volcano Tracking
Students study how to track seismic activity of the Montserrat volcano. They create graphs of the data, study the observation logs that accompany the data, and interpret the graphs in relationship to the logs.
Curated OER
Raisin the Statistical Roof
Use a box of raisins to help introduce the concept of data analysis. Learners collect, analyze and display their data using a variety of methods. The included worksheet takes them through a step-by-step analysis process and graphing.
Curated OER
Representation of Quadratic Functions
Students use a table, graph or equation to represent a quadratic function. In this algebra lesson, students model and graph with quadratic function. They become comfortable representing quadratics using different methods.
Curated OER
Vocabulary: Multiple Meaning Words in Context
Learners use context clues to define words with multiple meanings. After extensive practice with their teacher, learners read through six sentences, they then identify a word with a multiple meaning, and determine its meaning based on...
Curated OER
Slavery: Population Growth in Arkansas
Eighth graders examine the number of slaves in Arkansas in each census period from 1820 to 1860. They graph the data using the proper labeling and write a paragraph summarizing the data from each period making comparisons between slave...
Curated OER
The Election Connection
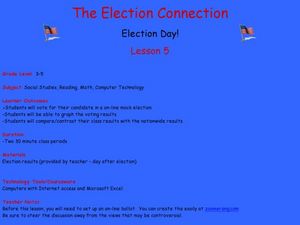
Students participate in a mock election. In this election lesson, students vote online in a mock election, graph the results, and compare their results to the nationwide results.
Curated OER
Discovery Research of Quadratics
Students investigate the properties behind the quadratic equation. In this algebra instructional activity, students identify quadratic equation in the real world. They graph the parabola and identify the vertex and intercepts.


