Curated OER
Using Data
In this analyzing data activity, 4th graders read, study and interpret a bar graph on how many hours Millie spends a week drawing each day. Students answer 2 short answer questions relating to the bar graph.
Curated OER
World Oil Reserves: Assignment
Understanding and analyzing data is a critical skill. Included here are three worksheets a list of countries with the largest oil reserves, a graph of the same, and an assignment. The class uses their data to create a bar chart then...
Balanced Assessment
Vacation in Bramilia
This performance task gives the population model of different types of flies and asks scholars to analyze the two populations. After interpreting the functions individually, participants compare the two populations and find the time when...
Special needs in Music
Music Work Sheet (Special Ed)
Music is beneficial for all learners. Help your learners with special needs learn about different styles of music, as well as the ways that music is represented on paper, with 30 different worksheets.
Federal Reserve Bank
Gini in a Bottle: Some Facts on Income Inequality
Delve into the hard numbers and fundamental concept of income inequality in the United States, using graphs, detailed reading materials, and an organized activity.
Curated OER
Spelling Connections Grade 6: Words With "graph"
In this spelling worksheet, students read ten clues to words with "graph". Students fill in the missing letters to complete the spelling words. There is no word list.
Curated OER
Horizontal Bar Graph: Changes in Nebraska Population
In this bar graph learning exercise, students learn about the changes in Nebraska's population from 1880 to 2000 by studying a bar graph. Students answer 7 questions about the graph.
Curated OER
Religious Book Sales Climb
In this analyzing data worksheet, students review a graph from the USA Today. Students study the graph and answer four questions about the graph. There are also two extension questions included.
Curated OER
Reading a Table
In this graphing worksheet, 4th graders focus on reading a given table. Students study a table and respond to 8 short answer questions.
Learner
Solid Shapes
A collection of two lessons, kindergartners will identify two-dimensional shapes in solid shapes. They will develop basic knowledge of the components that make up a sphere, rectangular prism, pyramid, cylinder, cone, and cube. Young...
West Contra Costa Unified School District
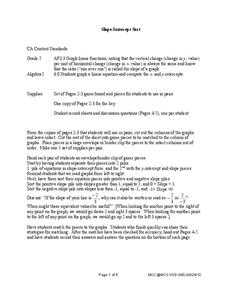
Slope-Intercept Sort
What's so special about slope? Pupils first match cards with slope and y-intercept to graphs of linear equations. They continue the lesson by matching equations in slope-intercept form to the same graphs.
Shmoop
ELA.CCSS.ELA-Literacy.SL.9-10.2
What are diverse media formats? Have your class figure this out on their own through small-group brainstorming. The resource includes two related activities about different kinds of data that will help your class get a grasp of media...
Public Schools of North Carolina
Math Stars: A Problem-Solving Newsletter Grade 2
Develop the problem solving skills of your young learners with this collection of math newsletters. Covering a variety of topics ranging from simple arithmetic and number sense to symmetry and graphing, these worksheets offer a nice...
Public Schools of North Carolina
Math Stars: A Problem-Solving Newsletter Grade 1
Keep the skills of your young mathematicians up-to-date with this series of newsletter worksheets. Offering a wide array of basic arithmetic, geometry, and problem solving exercises, this resource is a great way to develop the critical...
Inside Mathematics
Quadratic (2006)
Most problems can be solved using more than one method. A worksheet includes just nine questions but many more ways to solve each. Scholars must graph, solve, and justify quadratic problems.
Curated OER
Interpreting Graphs
In this algebra worksheet, students interpret graphs using given data and information. They are asked to relate real world scenario using algebraic equations. There are 31 questions with a variety of topics being covered.
Curated OER
Graphs of Formulas
In this worksheet students fill out a function table after reading a short word problem. This is a good way for students to practice the necessary skills for solving word problems or setting up algebra equations.
Curated OER
Graph: Number of Laysan Albatross Nests and Chicks at Kilauea Point
In this bar graph worksheet, students solve and complete 2 problems related to reading a bar graph. First, they use the data table found at the bottom of the sheet to complete the bar graph which illustrates the number of nests and...
Curated OER
Explore: Collect And Organize Data
In this exploring how to collect and organize data worksheet, students, working with a partner, problem solve the answers to seven word problems involving data.
Inside Mathematics
Population
Population density, it is not all that it is plotted to be. Pupils analyze a scatter plot of population versus area for some of the states in the US. The class members respond to eight questions about the graph, specific points and...
Edmond Public Schools
8th Grade Science Resource Book: Unit 2 - Physics
Get things moving with this extensive collection of physical science resources. Covering the fundamentals of measurement, graphing, lab safety, and experimental design as well as the specific scientific concepts of velocity,...
University of Georgia
Freezing and Melting of Water
Examine the behavior of energy as water freezes and melts. An engaging activity provides a hands-on experience to learners. Collaborative groups collect data and analyze the graphs of the temperature of water as it freezes and then...
Inside Mathematics
Scatter Diagram
It is positive that how one performs on the first test relates to their performance on the second test. The three-question assessment has class members read and analyze a scatter plot of test scores. They must determine whether...
Concord Consortium
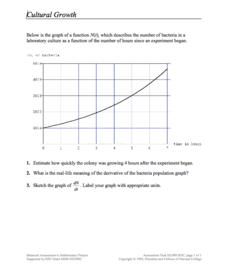
Cultural Growth
Scholars read and interpret a graph relating bacterial growth in a culture over time. They apply knowledge of derivatives, estimation, and graphing to the skill practice questions.


