Curated OER
Catching Some Rays
Sixth graders explore the tilt of Earth's axis. In this Earth lesson, 6th graders read a Greek mythology story explaining why there are seasons. Students build a sun-ray gathering tool from styrofoam, glue, thermometers, skewers, and...
Curated OER
In Line with Time
Third graders create a timeline of inventions and inventors made out of light colored bulletin board paper.
Curated OER
Standard Linear Form
Ninth graders identify and describe the x-intercept as the place where the line crosses the x-axis as it applies to football. They create their own differentiations to reinforce the distinction between the x-intercept and the...
Curated OER
Point-Slope Form
Ninth graders explore the point-slope form of linear equations and graph lines in the point-slope form. After completing the point-slope equation, they identify the slope of a line through a particular point. Students explain the...
Curated OER
Introducing Linear Terminology
Ninth graders graph linear equations and inequalities in two variables and then, they write equations of lines and find and use the slope and y-intercept
of lines. They use linear equations to model real data and define to define the...
Curated OER
Snow Cover By Latitude
Students create graphs comparing the amount of snow cover along selected latitudes using data sets from a NASA website. They create a spreadsheet and a bar graph on the computer, and analyze the data.
Curated OER
Exploring Slope
Young scholars explore the physical aspect of a slope. In this algebra lesson, students graph a slope and write an equation for a slope. They identify slopes of zero, negative lines and positive lines.
Curated OER
Integrated Social Studies and Math Lesson
Fourth graders study the American Civil War. They read and analyze information regarding the casualties of the Civil War, fucusing on Indiana soldiers. They graph the information and then write in their reflective journals responding...
Curated OER
Spaghetti Bridges
Eighth graders experiment with building bridges of spaghetti, pennies, and a cup to determine how varying the number of spagetti pieces affects the strength of the bridge. They graph their results and interpret the data.
Curated OER
Velocity vs. Time
Twelfth graders read and interpret v-t graphs. After studying velocity and time, 12th graders read graphs to calculate the acceleration of a moving body and determine the distance and displacement of a body. Students explore the...
Curated OER
Linear Equations Project Fram
Students engage in a lesson that focuses on the concept of linear equations. They practice solving problems with a variety of problems and graphing the solution set for each. Students write a summary paragraph about two methods of...
Curated OER
Systems of Equations
Students solve inequalities and systems of equations. In this algebra lesson, students use substitution and elimination as they solve algebraic systems. They use graphing and a table to support their solutions.
Curated OER
Remainder of One
Fifth graders are introduced to division and remainders. In groups, they are given a set of cubes and read the story a "Remainder of One". While reading the book, they use the cubes to represent the equations mentioned. To end the...
Curated OER
From Playing with Electronics to Data Analysis
Students collect and Analyze data. In this statistics lesson, students identify the line of best fit of the graph. They classify lines as having positive, negative and no correlation.
Curated OER
Relating Distance and Velocity Over Time
Students calculate the distance and velocity over time. In this algebra lesson, students graph a linear function to represent the distance vers time travel. They interpret their graphs and draw conclusion.
Curated OER
Earth Matters
Students identify Earth's equator, prime meridian, lines of latitude, lines of longitude, parallels, and meridians.
Curated OER
Butterflies in the Garden
Students estimate the population of a butterfly ecosystem and create a chart and graph based on information they find.
Curated OER
Integration and the "Barrier Breakers": Black Baseball 1945-1960
Students explore integration of Major League Baseball, identify important individual baseball players who played key roles in integration, and analyze historical information through charts, graphs, and statistics.
Utah Education Network (UEN)
Integers on a Coordinate Plane
Boogie fever! Explore the concept of integers on coordinate plane. In this integers on a coordinate plane instructional activity, students graph rational numbers on the coordinate plane and identify coordinates of a point. Students...
Curated OER
Cartesian Coordinate System
Students explore the Cartesian coordinate plane and plot points on the graph. They interpret coordinates for a point from the graph and give the ratio of rise over run for slope.
Curated OER
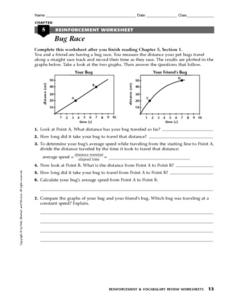
Bug Race
In this motion learning exercise, students compare two graphs showing a bug's distance traveled over time. Students calculate the average speed of the bugs and determine which bug was traveling at a constant speed. This learning exercise...
Curated OER
Patterns in Nature
In this patterns in nature learning exercise, students read about the Fibonacci Spiral, then follow the directions to plot one on the graph paper and draw the spiral, with links to more information.
Curated OER
Who is Being Left Behind?
Students investigate scores as they relate to race. In this algebra lesson plan, students analyze standardized scores and how race can affect these scores. They plot their findings on a graph and draw conclusions.
Curated OER
High School Examination: Algebra 2/Trigonometry
For this high school worksheet, students solve problems involving angles, functions, square roots, and sequences. They read word problems, write equations, and then solve them. This 28-page worksheet contains 39 problems.


