Curated OER
Making Estimations in Measurement
Students utilize their knowledge of measurement in making accurate measurements and estimations.
Curated OER
Planet Research
Students recognize that the other eight known planets, which revolve around the Sun, have characteristics and surface conditions that are different from Earth; and identify examples of those differences.
Curated OER
Propulsion Pop!
Students demonstrate an understanding of the text by completing a propulsion activity, charting the results, and answering questions that demonstrate an understanding of rocket propulsion.
Curated OER
Thank You... Thomas Edison!
Pupils investigate the life of Thomas Edison. They research how he made a difference. They understand that accurate data collection is important for math. They create a chart using spreadsheet data.
Curated OER
Oregon Rainshadows
Students brainstorm list of possible highest locations in Oregon, identify and label places from list on map using color code, and discuss and identify causes of a rain shadow.
Curated OER
Cultural Corner- "Mexico"
Young scholars use print and electronic resources to gather information about Mexico. They present a mini-museum to share with students, parents, and other interested classes around the district. They present their information in a video...
Curated OER
Salaries
Students are engaged in the study of salaries and how they vary according to different occupations. They conduct research using a variety of resources in order to summarize the earnings potential in the human services field.
Curated OER
Sorting Pennies, A Wagering Activity for Algebra I
Students solve weight equations. In this equations lesson, groups of students weigh and separate pennies to find information necessary to solve simultaneous equations. The teacher provides equations based on the weight of pennies before...
Cuemath
Cuemath: Line Graphs
A comprehensive guide for learning all about line graphs with definitions, their sections, how to read and create graphs, solved examples, and practice questions.
University of Illinois
University of Illinois: Line Graphs
Line graphs are shown and explained here. You can learn what kind of data is best represented using a line graph. There are also line graphs with questions and answers available to help you learn how to read them.
E-learning for Kids
E Learning for Kids: Math: Orange Trees, Olive Trees: Line Graphs
Explore even and odd numbers, fractions, counting, and line graphs with Scott amidst the olive and orange trees.
Texas Education Agency
Texas Gateway: Analyze Graphical Sources: Practice 2 (English I Reading)
This lesson focuses on practice exercises to understand and interpret the data in a graphic representations including pie charts, bar graphs, and line graphs.
Khan Academy
Khan Academy: Read Line Plots (Data With Fractions)
Practice reading and interpreting data that is graphed on line plots. The data graphed includes fractions. Students receive immediate feedback and have the opportunity to try questions repeatedly, watch a video or receive hints....
Primary Resources
Primary Resources: Line Graphs and Pie Charts
Here are a few resources to use with your students when teaching about line graphs or pie charts.
Utah Education Network
Uen: K Act. 05: Shared Reading: Greedy Cat's Breakfast
This lesson engages students in reading comprehension strategies related to Joy Cowley's book, Greedy Cat's Breakfast. Students will participate in making food glyphs of their favorite breakfast foods. Students will use the glyphs to...
Texas Education Agency
Texas Gateway: Analyze Graphical Sources: Practice 2 (English I Reading)
You will look at each of these types of graphs: bar graph, line graph, pie charts, as you work your way through the lesson.
Texas A&M University
Wtamu Virtual Math Lab: Beginning Algebra: Reading Graphs
A good introduction to reading bar, line, and double line graphs, and drawing and reading Venn diagrams. Contains definitions and examples of these types of charts and graphs as well as practice exercises that ask you to answer questions...
TeachEngineering
Teach Engineering: The Challenge Question: "Walk the Line"
Students are introduced to the "Walk the Line" challenge question. They are asked to write journal responses to the question and brainstorm what information they need to answer the question. Ideas are shared with the class (or in pairs...
Education Place
Houghton Mifflin: Eduplace: Make a Living Bar Graph
Student use simple data to line up in a living bar graph activity when they respond to simple questions in this lesson plan. They physically and visually represent the data. CCSS.Math.Content.3.MD.B.3 Draw a scaled picture graph and a...
University of Regina (Canada)
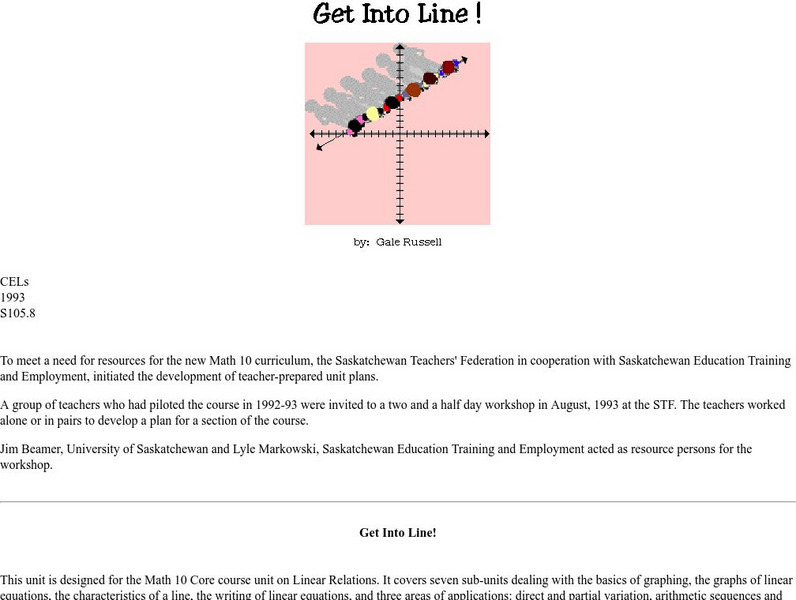
University of Regina: Math Central: Basics of Graphing
Students learn the basics of graphing including terminology, plotting, and reading points. The lesson has an overview, materials, procedures, and evaluation techniques.
University of Regina (Canada)
University of Regina: Math Central: Basics of Graphing
Students learn the basics of graphing including terminology, plotting, and reading points. The lesson has an overview, materials, procedures, and evaluation techniques.
The Math League
The Math League: Using Data and Statistics: Pie Charts
This introductory tutorial about statistical graphing with four examples of how pie charts (circle graphs) are constructed and read.
Colorado State University
Colorado State Writing Center: Charts
The use of charts and graphs can improve your presentations, whether on paper or as visual aids. Here you can read about how to create line, column, bar, pie graphs, and scatterplots. Just follow the links to their respective pages.
PBS
Pbs Mathline: Button, Button Lesson Plan [Pdf]
An integrated math and language arts activity focusing on statistics. Young scholars explore the concepts of estimation, data collection, data analysis, classification, graphing, and counting through the reading of the Button Box by...


