Curated OER
Scientific Observation of Force and Acceleration on an Object
In this force and acceleration worksheet, 8th graders answer ten questions based on two graphs. The first graph is a scatter plot, the second is a line graph.
Curated OER
Graph Lab
Seventh graders explore bar graphs and pie charts. Given a pack of M&Ms, 7th graders explore the colors, sort the data in a frequency chart and then construct bar graphs and pie charts to categorize the M&Ms by color. Students...
Curated OER
Straight Line Graphs
Students review the techniques of plotting and reading points on a grid. They identify why facts explaining how to read coordinates as well as the importance of the order in which the coordinates are given. Individual practice of...
Curated OER
Slope of a Line
In this slope of a line instructional activity, students read about line graphs and plotting the slope of a line. They read about the rate of change which is represented by the slope. Students practice finding the slope of lines.
Curated OER
Charts and Graphs
In this charts and graphs worksheet, students refer to charts and graphs to solve word problems. Students complete 10 multiple choice word problems.
Curated OER
Interpreting Graphs: Temperate Climates
For this interpreting graphs worksheet, students read a graph containing data of rainfall and temperature, then complete 18 questions, interpreting the data.
Curated OER
How Many More on a Graph?
First graders examine data on a graph and determine which variable on the graph has more. They draw pictures of their family members and determine which families have more members than other families. Using squares of paper to depict...
Illustrative Mathematics
The Circle and The Line
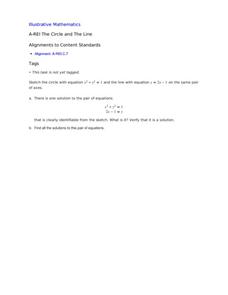
Here is a resource where algebra learners show their understanding of a system of equations involving a circle and a line. Once graphed, learners see two points of intersection, one where the ordered pair is read, and a second where...
Mathematics Assessment Project
Middle School Mathematics Test 3
Real-life mathematics is not as simple as repeating a set of steps; pupils must mentally go through a process to come to their conclusions. Teach learners to read, analyze, and create a plan for solving a problem situation. The provided...
Curated OER
How Do Plants Grow?
Students investigate plant growth. In this plant growth lesson, students investigate what would happen to plants if they did not have water and sunlight. Students conduct experiments to determine what plants need. Students create a...
Curated OER
Graphs
In this graphs worksheet, 10th graders identify and solve 10 different problems that include reading various graphs of lines. They determine the equation for each graph whether it is dealing with tangent, cotangent, secant or cosecant.
Curated OER
Graphing
Fifth graders practice using math graphs. In this graphing instructional activity, 5th graders work in groups to develop a topic of their own to represent as a graph. Students collect data and construct a graph for the instructional...
Curated OER
The Impact
Learn about the destruction of the rainforest by analyzing statistics. Young learners make an original line graph showing destruction in the rainforest. Additional activities include making a collage, sequencing Dr. Seuss' The Lorax,...
Curated OER
A Reading Graph
Students construct and interpret a "favorite classroom books" graph. In this literacy and math graphing lesson, students choose a reduced size copy of the book cover that corresponds with the book(s) they chose to read during their...
Curated OER
Graphing and the Coordinate Plane
Students examine the four quadrants of Cartesian coordinate plane. They play maze games and coordinate games to discover how to read and plot points on the plane. Students plot points on the coordinate plane and examine the ratio of...
Curated OER
Making Circle Graphs
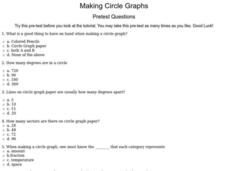
In this circle graphing worksheet, 6th graders answer ten multiple choice questions based on their knowledge of circle graphs. This is an interactive worksheet.
Curated OER
What's Your Line?
Fifth graders collect temperature readings over a period of time, enter the information into a spreadsheet and choose the appropriate graph to display the results.
Curated OER
Graphing Data Brings Understanding
Students collect, graph and analyze data. In this statistics lesson, students use circle, pie, bar and lines to represent data. They analyze the data and make predictions bases on the scatter plots created.
Curated OER
All in the Family
Learners use data to make a tally chart and a line plot. They find the maximum, minimum, range, median, and mode of the data. Following the video portion of the lesson, students will visit a Web site to test their data collection skills...
Curated OER
Curious Clouds
Second graders explore clouds. They read The Cloud Book by Tomie dePola. Students sort the cloud pictures into three categories. Students create a graph using the cloud pictures. They use Excel to create a bar graph.
Curated OER
Bald Eagle Population Graphing
Young scholars create graphs to illustrate the bald eagle population. They identify the population of bald eagles in Minnesota and the United States. They create three graphs to represent the population data including a line, bar, and...
Inside Mathematics
Population
Population density, it is not all that it is plotted to be. Pupils analyze a scatter plot of population versus area for some of the states in the US. The class members respond to eight questions about the graph, specific points and...
Inside Mathematics
Scatter Diagram
It is positive that how one performs on the first test relates to their performance on the second test. The three-question assessment has class members read and analyze a scatter plot of test scores. They must determine whether...
EngageNY
Geometric Interpretations of the Solutions of a Linear System
An intersection is more than just the point where lines intersect; explain this and the meaning of the intersection to your class. The 26th segment in a 33-part series uses graphing to solve systems of equations. Pupils graph linear...


