Royal Baloo
Star Wars K-2nd Math Pack
Included in a Star Wars themed packet, young padawans enhance mathematical skills such as graphing, computing using basic operations, counting numbers and money, telling time, and measuring. Scholars play a game of sudoku, read number...
Curated OER
Changing Planet: Sea Levels Rising
Begin by showing a six-minute video, Changing Planet: Rising Sea Level as an anticipatory set. Pupils draw a topographic map of a potato continent. Finally, they will visit NOAA's sea levels online map and NASA's carbon dioxide...
Texas State Energy Conservation Office
Investigation: Kinetic and Potential Energy
A well-developed lab sheet guides physical science learners through an investigation of kinetic and potential energy. In small groups, collaborators discover whether or not the ramp height or mass of an object has an effect on the...
Federal Reserve Bank
Would Increasing the Minimum Wage Reduce Poverty?
Here is a fantastic and relevant question to discuss with your class members. Using detailed reading material and a related worksheet, your learners will learn about labor markets, equilibrium wages, price floors, and who exactly would...
Curated OER
Data Analysis, Probability, and Discrete Mathematics
Fourth graders analyze the data in a bar graph, pictograph, line graph, and a chart/table and draw conclusions based on the data. They discuss each type of graph, write questions for each graph, and analyze the data as a class.
Curated OER
Interpreting Data and Statistics
Students define terms and analyze data. In this statistics lesson, students plot their data using bar and line graphs. They analyze their data after they graph it and apply the results to the Great Depression.
Curated OER
Temperature and Tracking Weather
Fourth graders discuss, describe and track weather by utilizing a variety of measurable quantities as temperature, wind speed, wind direction, cloud conditions and precipitation. They assess, through experiments and practicing, how to...
Curated OER
Show Me!
Students analyze and interpret graphs. In this graphing lesson, students view a video and construct their own graphs (line, circle, bar) from given sets of data.
Curated OER
Graphing Exercise of Ideal Gas Data
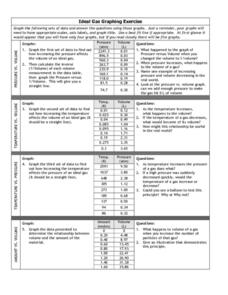
For this graphing of Ideal Gas Data worksheet, students use the given data to draw 4 graphs of the given data. They are given the pressure and volume to draw and interpret the graphs.
Curated OER
Graphing Favorite Holidays
Students create spreadsheets and bar graphs based on results of survey of favorite holidays.
Curated OER
Coordinate Graphing
Students practice basic coordinate graphing and plotting points on the coordinate axis. In this geometry lesson, students are introduced to ordered pairs, and the x and y axis.
Curated OER
Exploring Quadratic Graphs
Students solve quadratic equations using graphs. For this algebra lesson, students factor quadratic equations and graph their answer. They discuss the shape of their graph based on the function.
EngageNY
Lines That Pass Through Regions
Good things happen when algebra and geometry get together! Continue the exploration of coordinate geometry in the third lesson plan in the series. Pupils explore linear equations and describe the points of intersection with a given...
Rice University
Introductory Statistics
Statistically speaking, the content covers several grades. Featuring all of the statistics typically covered in a college-level Statistics course, the expansive content spans from sixth grade on up to high school. Material comes from a...
Mathed Up!
Frequency Polygons
Frequency polygons are a different way to represent frequencies over intervals. Pupils take frequencies for intervals of data from a frequency table and plot them as a frequency polygon. Budding mathematicians find information about the...
Curated OER
Graphs Galore
Fourth graders conduct surveys to collect data. They analyze and interpret the data, then determine which type of graph is appropriate for the data. Students use the data to make predictions, discover patterns and draw conclusions...
Curated OER
Graphing Data from the Chemistry Laboratory
Students graph and analyze data using a spreadsheet.
Curated OER
Chapter Books
In this line plot instructional activity, students create a line plot of the chapter books read by the students of a class and find the median and mode. Students complete 3 tasks.
Curated OER
Let's Graph It
In this let's graph it worksheet, student interactively answer 10 multiple choice questions about graphing data and types of graphs, then click to check their answers.
Curated OER
Temperature
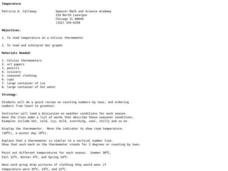
Learners explore the concept of temperature. In this temperature lesson, students read thermometers in degrees Celsius. Learners discuss the temperature of the seasons and what clothing they might wear given a certain temperature....
Curated OER
Introduction to Topographic Maps
Tenth graders create a topographic map and see how it represents different elevations. In this topographic maps instructional activity students read and interpret topographic maps.
Curated OER
Using Charts and Graphs to Study East Asia's Modern Economy
Students examine East Asia's modern economy. In groups, classmates use the internet to compare the resources, products, and economy of specified countries. After collecting the data, pupils create charts, tables and graphs. They...
Curated OER
Equations and Inequalities
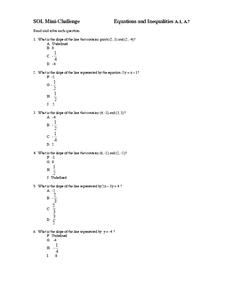
In this equations and inequalities learning exercise, 9th graders solve and graph 10 different problems that include determining the slope of a line in each. First, they determine the line that contains given points on a grid. Then,...
Curated OER
Math and Money
Students explore personal finance. In this middle school mathematics instructional activity, students investigate banking, income tax, and the cost of living. The instructional activity includes two bonus lessons on graphing their...


