Inside Mathematics
Population
Population density, it is not all that it is plotted to be. Pupils analyze a scatter plot of population versus area for some of the states in the US. The class members respond to eight questions about the graph, specific points and...
University of California
Seasons Lab Book
Unlock the mystery behind seasonal change with a collection of worksheets and activities. Whether they are drawing pictures of Earth's orbit around the sun or graphing the temperature and daylight hours of different locations from around...
Worksheet Web
Using Pictographs
If one ice cream cone represents three ice cream scoops, and Bob has four ice cream cones, then how many scoops does Bob have? Learners solve these kind of questions with their new understanding of pictographs.
Curated OER
Collecting Data
In this data collection worksheet, students read about how data is collected and organized. They also learn about a hypothesis. Students read through examples of different charts and then answer 23 questions pertaining to data...
Curated OER
New York State Math Test Grade 4
In this New York state math test worksheet, 4th graders complete multiple choice questions on money, multiplication, graphs, and more. Students complete 39 questions.
Curated OER
The Egg Hunt- Using a Graph to Answer Data Questions
In this pictograph instructional activity, learners answer questions based on a pictograph that shows colored Easter eggs. They follow the key that shows that each egg picture is equal to 10 eggs. They fill in the blanks with answers to...
Curated OER
Math And Reading
In this math and Language Arts worksheet, learners mark the vowel sound they hear for each picture and write a sentence about a picture. Students also use a graph to answer three questions.
Curated OER
Graphing Ordered Pairs
In this math worksheet, students learn to graph ordered pairs. Students examine a graph with 3 labeled points and tell the ordered pairs for each. Students also plot 8 ordered pairs on a graph they draw themselves.
Curated OER
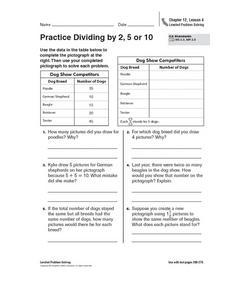
Practice Dividing by 2, 5, or 10
In this pictograph problem solving worksheet, students analyze the data on a table and create a pictograph. Students read and solve 6 story problems about the pictograph.
Curated OER
New York State Testing Program: Mathematics Test Book 1
In this mathematics test bookelt, students solve problems studied during the year. They solve problems covering topics such as probability, angle intersection, commission, percent, exponents, similar figures, and reading and...
Yummy Math
Deflate-gate
Does temperature affect the air pressure of a football? Young mathematicians look at the readings from a pressure gauge and determine if the balls are within regulation or are under inflated.
Curated OER
Nonfiction Sharing Board
In this nonfiction sharing board worksheet, students complete questions about the books main idea, vocabulary, facts, connections. Students also graph information from the book, go beyond the text, and evaluate how they felt about the...
Charleston School District
Analyzing Scatter Plots
Scatter plots tell a story about the data — you just need to be able to read it! Building from the previous lesson in the series where learners created scatter plots, they now learn how to find associations in those scatter plots. They...
Curated OER
Frequency Table
In this frequency table worksheet, students create a frequency table from given data. They identify the mode. Students read and interpret frequency tables. This one-page worksheet contains 7 multi-step problems.
Curated OER
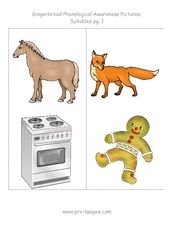
Gingerbread Phonological Awareness Pictures: Syllables
In this syllables worksheet, students say the name of the horse, fox, gingerbread man, and stove. Students listen to the phonological sounds and syllables in the words.
Math Stars
Math Stars: A Problem-Solving Newsletter Grade 6
Think, question, brainstorm, and make your way through a newsletter full of puzzles and word problems. The resource includes 10 different newsletters, all with interesting problems, to give class members an out-of-the box math experience.
Curated OER
Melissa's Garden
In this math activity, students identify the location of pictures on a coordinate plane. They write some answers as an ordered pair. They read ordered pairs and identify the picture at a specified location. Six problems are on a page. An...
Public Schools of North Carolina
Math Stars: A Problem-Solving Newsletter Grade 1
Keep the skills of your young mathematicians up-to-date with this series of newsletter worksheets. Offering a wide array of basic arithmetic, geometry, and problem solving exercises, this resource is a great way to develop the critical...
Curated OER
Is the Hudson River Too Salty to Drink?
In this estuary worksheet, students examine data about the salinity of the Hudson River, create a graph from given data and complete 12 short answer questions about the data and graph.
Curated OER
Surface Area of a Leaf (Grades 7-9)
In this math and science activity, students read about the process of photosynthesis and plant growth. They determine how a plant's ability to create food is dependent on the surface area of its leaves using geometric calculations. They...
Curated OER
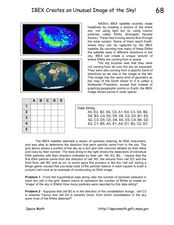
IBEX Creates an Unusual Image of the Sky!
In this IBEX satellite worksheet, students read about the Energetic Neutral Atoms that are detected by the IBEX satellite. Students use a given hypothetical data string to determine the number of particles detected and create an 'image'...
Curated OER
Bringing an Online News Report to Life
In this online news report tips activity, students read five tips about creating an online report and then write five tips of their own.
Curated OER
Math Who Am I?
For this math vocabulary worksheet, students read each description of a math term and write the word on the blank line. They circle every third letter in each letter box next to the clue to check their answer. They complete 8 definitions.
Curated OER
New York State Testing Program: Mathematics Test Book 2
In this mathematics test book, students answer problems dealing with topics covered during the year. They solve problems dealing with percent, probability, properties, and interpreting graphs. This sixteen page worksheet contains...


