Curated OER
Observing Weather
Students investigate the weather by reading children stories. For this weather observation lesson, students read Cloudy With a Chance of Meatballs and several other stories about weather before they create a KWL chart. Students utilize...
Curated OER
Student Costs Data Table
Students compare and contrast two routes selected for a virtual field trip. They create a data table of educational activities, lodging, and meal costs using Microsoft Excel software.
Curated OER
Statistics: Reading and interpreting production graphs
Students interpret and create different types of graphs. They analyze data from charts, develop a survey and design appropriate graphic illustrations and make a presentation.
Curated OER
Moooooove into Graphing
First graders explore graphing software and create their own graph of farm animals. Then students analyze their graph using the teacher made worksheet which is imbedded in this lesson plan. Great lesson plan!
Curated OER
Rainbow Fish Graphing
Pupils graph different colors of rainbow fish scales after participating in a shared reading of The Rainbow Fish. They answer questions based on the graph. They practice making graphs independently using colored cereal circles.
Curated OER
Weather Graphs
First graders use their knowledge of weather symbols to organize and construct a graph of the daily weather for one month. Each student have a chance to give the daily weather report using Sammy's Science House Computer Software.
Curated OER
Teaching the Five Themes of Geography Through Picture Books
Read the story Make Way for Ducklings and introduce little ones to the five themes of geography. Reread the story, while displaying transparencies to reinforce the five themes. In groups, learners view pictures and identify the themes on...
Curated OER
The Egg Hunt- Using a Graph to Answer Data Questions
In this pictograph instructional activity, learners answer questions based on a pictograph that shows colored Easter eggs. They follow the key that shows that each egg picture is equal to 10 eggs. They fill in the blanks with answers to...
Curated OER
Math And Reading
In this math and Language Arts worksheet, learners mark the vowel sound they hear for each picture and write a sentence about a picture. Students also use a graph to answer three questions.
Curated OER
Graphing Ordered Pairs
In this math worksheet, students learn to graph ordered pairs. Students examine a graph with 3 labeled points and tell the ordered pairs for each. Students also plot 8 ordered pairs on a graph they draw themselves.
Curriculum Corner
7th Grade Math "I Can" Statement Posters
Translate the Common Core math standards into a series of achievable "I can" statements with this collection of classroom displays. Offering posters for each standard, this resource is a great way to support your seventh graders as they...
Curated OER
Weather "Whys" Lesson 2 Seasons
Young scholars explore seasons. In this cross curriculum weather and seasons lesson plan, students identify characteristics of the four seasons and sequence related pictures. Young scholars listen to poems and stories about trees in...
Curated OER
Literacy Activity: The Perfect Pet
Students develop their listening skills as they listen to the book The Perfect Pet. For this reading lesson, students listen to the book, and then talk about the pets they have. Then they make a graph as a class of all their pets.
Curated OER
The First Strawberries
Young scholars explore Cherokee legends. They read The First Strawberries by Joseph Bruchac, and then do several activities to help comprehension. They discuss the book and answer comprehension questions. In addition, they retell the...
Curated OER
How Do You Like Your Eggs?
First graders conduct a poll about how people like their eggs. In this graphing lesson plan, 1st graders collect data about how they like their eggs. Students use a picture of themselves to place under the type of egg they like. Students...
Curated OER
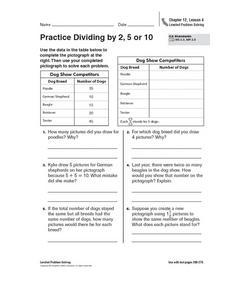
Practice Dividing by 2, 5, or 10
In this pictograph problem solving worksheet, students analyze the data on a table and create a pictograph. Students read and solve 6 story problems about the pictograph.
Curated OER
Creating Stories Using Pictographs
Fourth graders research pictograph stories written by Native Americans. They investigate the history behind pictographs, and look through a reference book identifying the different pictures. The teacher then create their own individual...
Curated OER
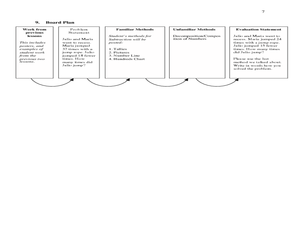
Mathematics Lesson Plan
Second graders study subtraction facts. In this mathematics instructional activity, 2nd graders discuss how to solve two digit subtraction problems. Students recognize that there are many different methods or strategies one can use such...
Redefining Progress
Have and Have-Not
Is there a correlation between a country's wealth and the extent of its ecological footprint? What exactly constitutes an ecological footprint, and how does one country stack up against the rest? This is a unique instructional activity...
Curated OER
A Plump and Perky Turkey
Help readers recognize elements in a story. They will use pictures and text to gain meaning from written material. Have learners listen to the story A Plump and Perky Turkey and participate in a discussion. They recognize the Internet...
Curated OER
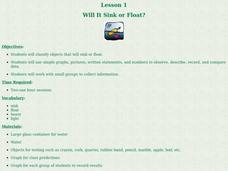
Will It Sink or Float?
Students perform experiments to see if items will sink or float. In this sink or float lesson, students work in groups to make predictions, and record the results. After the experiments are complete students make a book of the results.
Curated OER
OUR FAVORITE BEARS
Students state bear facts aloud, practice counting the nuber of bears aloud on the picture graph, read the picture graph and answer questions aloud about the data on the picture graph, and draw a picture of their favorite bear.
Curated OER
New York State Testing Program: Mathematics Test Book 1
In this mathematics test bookelt, students solve problems studied during the year. They solve problems covering topics such as probability, angle intersection, commission, percent, exponents, similar figures, and reading and...
Alabama Learning Exchange
Yummy Apples!
Young learners listen to a read aloud of Gail Gibbons book, Apples and the story A Red House With No Windows and No Doors. They compare characteristics of a number of kinds of apples, graph them and create a apple print picture. Learners...


