Curated OER
Geoboard Area
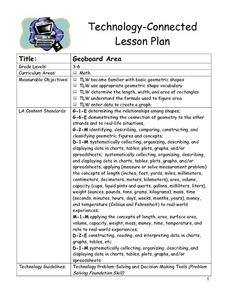
Students explore the basic geometric shapes and geometric shape vocabulary through the use of geoboards and virtual geoboards. They create a variety of shapes with a partner, build ten different rectangles on their geoboards, and...
Curated OER
Combination Factory
Fourth graders use cut-outs of clothing to illustrate the numbers of combinations of articles of clothing they can create. Students create a tree-diagram and count the number of possibilities. They practice showing the information in...
Curated OER
Whole Numbers
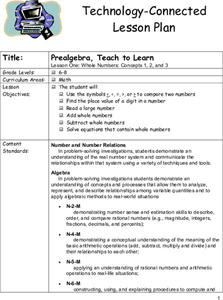
Student are assigned one of the sections on whole numbers. After reviewing the content, they teach their assigned sections to other class mates. They publish their findings on a PowerPoint slide show to use when they teach their section.
Curated OER
Money Management Intelligence
Learners follow directions to help a client with his/her budget. After selecting their client, they download confidential data and listen to the challenge presented on the website. They adjust the budgets as needed. Then, they click play...
Curated OER
Length, Perimeter and Area
Learners analyze characteristics and properties of two- and three-dimensional geometric shapes and develop mathematical arguments about geometric relationship
Curated OER
Touring Delmarva
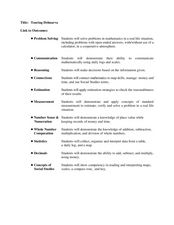
Learners plan a trip. In this trip planning lesson, students use a map to find where they would like to visit with a pretend family of 4. They get a specific amount of money and time and need to decide where they will stay and what they...
Curated OER
Using Measurement in the Everyday World
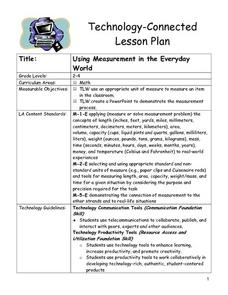
Students use an appropriate unit of measure to measure an item in the classroom. They create a PowerPoint to demonstrate the measurement process. Pupils are divided into pairs. Students use a concept map to discuss the terms for...
Curated OER
I'm Late, I'm Late, for a Radioactive Date!
Through the use of an interactive Web site, students explore C-14 and C-14 dating. Then students analyze an article written about the C-14 dating of the Shroud of Turin and draw conclusions.
Curated OER
Baseball Relationships - Using Scatter Plots
Young scholars use graphing calculators to create scatter plots of given baseball data. They also determine percentages and ratios, slope, y-intercepts, etc. all using baseball data and statistics.
Curated OER
Passive Integrator and Differentiator Circuits
In this circuits worksheet, students answer 25 questions about passive integrator circuits and passive differentiator circuits given schematics showing voltage. Students use calculus to solve the problems.
Curated OER
Data, Data, Everywhere... and What Am I To Think?
Students demonstrate good random sampling techniques for data collection, select and develop graphic presentations of data and analyze the data to solve a problem presented.
Curated OER
It's In The Chocolate Chips
Students investigate which brand of chocolate chip cookies contains the most chocolate. They analyze and compare data using Microsoft Word and Microsoft Excel. They communicate the results with Microsoft PowerPoint.
Curated OER
Surface Area of Prisms
Students compute surface area and volume of prisms. In this surface area lesson, students find the surface area and volume of rectangular and triangular prisms. Independently, students use their computers to determine the volume,...
Curated OER
Fruit Loop Graphing
Fifth graders interpret data and create graphs. Given Fruit Loops, they sort and classify according to color. Using spreadsheet technology, 5th graders record their data and create bar and circle graphs. Students analyze data and...
Curated OER
Making Patterns - Create, Analyze, and Predict
Fourth graders practice making patterns using Unifix cubes and identify, analyze, and determine rules for describing numerical patterns involving operations and nonnumerical growing patterns. They also find an example of a pattern in...
Curated OER
Numbers and Me
Students collect and graph data about themselves. In this collecting and graphing data lesson plan, students poll their classmates about how many siblings they have or they measure their height. Students make a bar graph of their data....
Curated OER
Bedroom Redecoration Project
In this bedroom redecoration project, your young mathematicians become interior designers. They plan, draw, and determine finances for the project. They apply their knowledge of working with decimals, geometric shapes, and problem...
Curated OER
Party Time
Students engage in a lesson about finding information from the grocery store to put into data that can be measured. The data is found in advertisements and food labels. They plan the cost of a party when using the unit cost of various...
Alabama Learning Exchange
The Mean, Median, and Mode Chain Gang
Students analyze a set of data. They work in cooperative groups and use chain links to identify the mean, median, and mode of the chain.
Curated OER
Infrared-Hot
Students describe how the sun heats the Earth, explain the nature of infrared light, explain how thunderstorms are formed and use infrared maps to predict severe weather.
Curated OER
Cost Of Cool
Students explore how marketers use the idea of "cool" to sell clothing and accessories, and become aware of their own attitudes and perceptions about what is cool. They become aware of what motivates them to buy certain things
Curated OER
Cookie Mining
Students start with $19 of Cookie Mining Money with which they must buy his/her own "mining property" or cookie. After cookies are bought, students give their "mine" a name, record it, along with the price of their cookie on the sheet.
Curated OER
Train vs. Car: Who Wins?
Ninth graders conduct an experiment demonstrating what happens when a train hits a car using easily accessible materials. They calculate momentum, velocity, and distance using the appropriate formulas. Then they write an incident report...
Curated OER
Sliding Along
Third graders explore the concept of linear measurements and how they work. Coins are used to reinforce the process.


