Curated OER
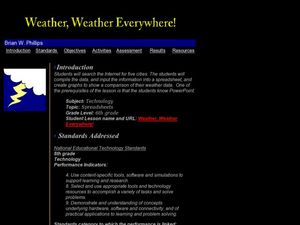
Weather, Weather, Everywhere!
Sixth graders collect weather data to compare temperatures around the world. Using the Internet, learners collect data, put it into spreadsheets, and analyze and graph the results. An interesting way to cover the topic of weather.
Curated OER
Virtual Field Trip
This hands-on resource has future trip planners analyze graphs of mileage, gasoline costs, and travel time on different routes. While this was originally designed for a problem-solving exercise using a Michigan map, it could be used as a...
Curated OER
Height versus Shoe Size
Students find a correlation between a person's height and his/her shoe size. They have access to entering data into lists on a graphing calculator and can complete scatter plots. Students read and interpret a scatter plot and use the...
Curated OER
What Are You Eating?
Discover the calorie content of foods by observing how much heat they produce in water. If you have a calculator-based laboratory (CBL™) insturment for collecting data, then this laboratory worksheet will not need any changes. If not,...
Curated OER
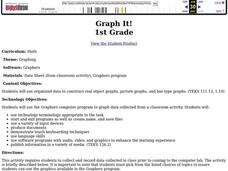
Graph It!
First graders use organized data to construct real object graphs, picture graphs, and bar-type graphs.
Curated OER
Data Days
Sixth graders practice collecting, organizing and displaying data. They create circle, bar, line and picto graphs. They analyze data in small and large sample groups.
Curated OER
Graphing Pockets
Second graders explore graphing. They count the number of pockets on their clothes and use Microsoft Excel to enter their data. Students create a class graph displaying their findings.
Curated OER
Walking the Plank
Eighth graders experiment with a bathroom scale, books and a plank to determine how weight readings change as distance is applied. They graph and interpret the results.
Curated OER
Bubbles
Third graders perform an experiment using different mixtures of dishwasher detergent. They construct bar graphs that record their bubble data for each detergent set.
Curated OER
Creating Bar Graphs
Students create bar graphs based on the names in their family. In this bar graphs instructional activity, students collect the names of the their family members, graph the names into a graphing computer program, and compare the data with...
Curated OER
Sunspot Graphing
Students, using 15 years of sunspot data, plot data on a classroom graph. They discuss why the pattern from their individual sheets did not and could not match the class graph.
Curated OER
Creating Bar Graphs
Fifth graders design and label a bar graph using data taken from a class survey. They observe a teacher-led lecture, write and conduct their survey, and create a bar graph that includes identification of the minimum, maximum, mode,...
Curated OER
Graphing Galore!
Students practice sorting and counting different objects. Using this information, they create graphs on a worksheet given to them. They describe and analyze the results and discuss them as a class to end the lesson. They also complete...
Curated OER
Chart/Graph
Students create a class survey, place the data in a spreadsheet and graph the information.
Curated OER
Creating Bar Graphs and Pie Graphs
Second graders observe a demonstration of the creation of a bar graph and a pie graph of their favorite colors. They gather information about various topics from their classmates, then organize the information, creating a bar and a pie...
Curated OER
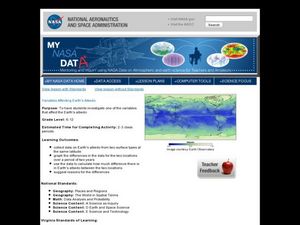
Variables Affecting Earth's Albedo
Students study the variables that affect the Earth's albedo. In this environmental data analysis lesson plan students interpret and graph information and calculate changes.
Teach Engineering
Solar Power
Elementary schoolers discover how engineers use solar energy to heat buildings. They take a close look at some of the materials used: sand, salt, water, and shredded paper and evaluate the efficiency of each material. An incredible...
Curated OER
"One Day in the Prairie" by Jean Craighead George
Students collect "prairie insects" for data collection and analysis.
Curated OER
Get the Picture?
Students explore the movement to design low-cost solutions for the world's population and create a graph to represent the information. In this design and graphing lesson, students review the concepts of graphing and visit the...
Curated OER
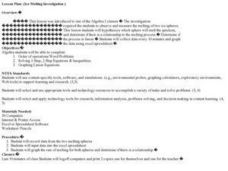
Ice Melting Investigation
Learners conduct an ice melting investigation in which they observe and measure the melting of two ice spheres. They develop a hypothesis as to which sphere will melt the fastest, collect data every ten minutes, and graph the data using...
Curated OER
Just Graph It!
Fourth graders evaluate various graphs for the best way to reflect statistical data. They use a spreadsheet to organize data and generate varied graphic representations. They select the graph they feel best shows their results.
Curated OER
Pet Count Excel Graphing
Students used collected data to distinguish what pets they have or would like to have. They correlate findings with appropriate technology--Excel. At the end of the lesson they tabulate a bar chart and present their findings to the class.
Curated OER
TE Activity: Heavy Helicopters
Students study the concepts of weight and drag while making paper helicopters. They measure how adding more weight to the helicopter changes the time for the helicopter to fall to the ground. They apply what they examine to the work of...
Curated OER
Water Down the Drain
Did you know that leaky faucets waste $10 million worth of water? Conservationists perform an experiment and draw best-fit lines to explore how the US Geological Society determined this value.


