EngageNY
Modeling Relationships with a Line
What linear equation will fit this data, and how close is it? Through discussion and partner work, young mathematicians learn the procedure to determine a regression line in order to make predictions from the data.
American Museum of Natural History
Rising CO2! What Can We Do?
It is colorless and scentless, but it makes a large impact on the environment. Learners explore carbon dioxide emissions and what they mean for the environment using an interactive graph. They review changes over time and how they impact...
Virginia Department of Education
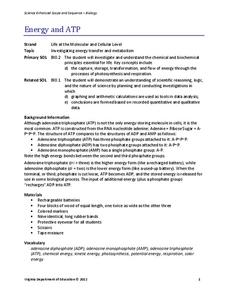
Energy and ATP
Take charge of your biology class by using this exciting analogy to relate the ATP process with batteries. Pupils use batteries and rubber bands to simulate the phosphate bonds between molecules in the body. They measure the distance in...
abcteach
Community Walk
Invite your pupils to explore their surroundings with a walk around the neighborhood. Learners use their senses to make observations about their surroundings.
Concord Consortium
Specific Heat and Latent Heat in Condensation
There's more to melting than meets the eye! Junior physical chemists investigate the differences between specific and latent heats as a substance undergoes a phase change. Users remove heat from the system and observe changes in kinetic...
Centers for Disease Control and Prevention
Youths Are Exposed to E-Cigarette Advertisements from Multiple Sources
The use of tobacco and alcohol use among young people is increasing. Vaping in particular, is gaining popularity with middle and high school students. A colorful infographic details the top four sources of advertising accessed by young...
Curated OER
Bugs, Bugs, Everywhere!
Students collect and compare bugs using magnifying lenses and graph data based on their comparisons. In this bugs lesson plan, students also make an aspirator by using a jar, tubing, and screen.
Curated OER
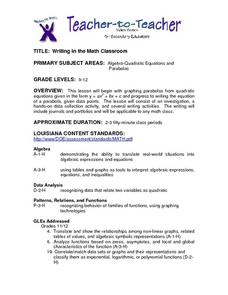
Writing in the Math Classroom
Students determine the vertex, y-intercept and direction of a parabola and write an explanation of how to graph a parabola. They collect and graph data using a calculator.
Curated OER
Curve Fitting and the TI-85 Calculator
Seventh graders follow a step-by-step guide for using graphing calculator to determine equations which best fit data graphed. They gather data from various sites on the web, or they do searches to find information necessary to complete...
Curated OER
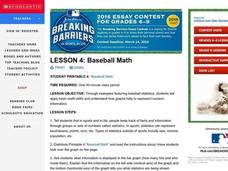
Baseball Math
Students collect data on baseball plays. In this statistics lesson, students graph their data and make predictions based on their observation. They calculate what the probability is that a favorable outcome would happen.
Curated OER
Tallies Tell It All
Students explore data collection through the use of tally marks. After a demonstration of the use of tally marks students complete various inquires where they create a chart documenting the number of times a desired result happens. They...
Curated OER
Creating a Spreadsheet
Students create a spreadsheet using ICT. In this algebra lesson, students collect and graph their data using a spreadsheet. They find solution to a given problem using trial and error.
Curated OER
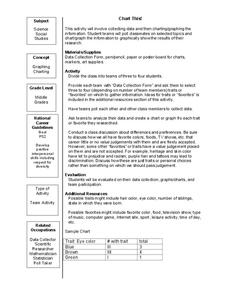
Chart This!
Students collect data and graph or chart the information. In this data organization lesson, students poll their classmates about certain topics and chart or graph the information to show the results of their research.
Curated OER
Bones and Math
students identify and explore the connection between math and the bones of the human body. Students collect data about bones from their classmates and from adults, apply formulas that relate this data to a person's height, and organize...
Curated OER
Which Color Will You Pick?
Students create a spreadsheet to chart the different colors found in a package of M&M's or Skittles. They collect data, create appropriate charts, and use percentages to describe quantities.
Curated OER
The M&M's Brand Chocolate Candies Counting Book
First graders use estimation skills and gather data and record their findings
Curated OER
Graphing Data on Ellis Island
Third graders use data to make a bar graph. In this graphing and social studies lesson, 3rd graders use data about where Ellis Island immigrants came from to complete a bar graph on Microsoft Excel.
Curated OER
Collect Your Own Drosophila Lab
Students study Drosophila by catching them. They construct catcher-containers to catch Drosophila using fruit as bait. After collection, they examine the flies and collect data to be displayed.
Curated OER
Energy and Changes of State
Students complete a variety of labs to help them explain how energy affects the changes in states of matter. They also be required to collect and record data, graph data, and apply interpretations of that data.
Curated OER
Global Warming Statistics
Learners research and collect data regarding temperature changes for a specific location and find the mean, median, and mode for their data. In this climate change lesson plan, students choose a location to research and collect data...
Curated OER
Conservation of Mass
In this conservation of mass worksheet, students design an investigation to demonstrate the Law of Conservation of Mass. Students describe their investigation, collect data, graph the data and write a conclusion about what they discovered.
Curated OER
Pick's Theorem
Students investigate polygons and their lattice. In this calculus lesson, students record data using different methods. They analyze their data and draw conclusions based on the relationship between the area and the interior lattice.
Curated OER
Displaying Populations: Jellybeans, Paper and People
Students investigate the factors affecting population growth. In this biology lesson, students collect data from the lab and graph them. They estimate population size using a mathematical formula.
Curated OER
Adhesives: How Sticky is Your Tape?
Students test the adhesive strength of different tapes. In this adhesive lesson, students conduct an experiment to test the shear strength of the adhesives, take measurements, record data, and draw conclusions to explain each product's...


