Curated OER
Inclined Plane and Pulley
Learners describe how inclined plane and pulleys make work easier. In this physics lesson, students calculate work done and mechanical advantage of both simple machines. They collect data from the experiment and construct graphs.
Curated OER
Trajectory Perplexity
Students investigate measuring angles correctly through projectiles. For this geometry lesson, students launch a projectile to investigate the importance of how to measure an angle correctly and to explore trajectory. They collect data...
Curated OER
Biodiversity and Ecosystems
Middle schoolers differentiate between biotic and abiotic factors in this science lesson plan. Learners collect data for the experiment and analyze the data after graphing it using the CBL 2. This experiment is split into two different...
Curated OER
The Apple Orchard Problem
Students explore various approaches to solving a problem of maximizing the total production of apples in an orchard. In this apple orchard lesson, students collect data in order to solve the apple orchard problem presented. Students plot...
Curated OER
Approximation of Pi
Students explore the concept of Pi. For this Pi lesson, students measure the circumference and diameter of a circle. Students record the diameter and circumference measurements from their classmates. Students enter the data into lists...
Curated OER
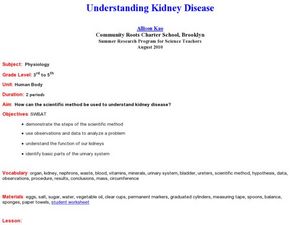
Understanding Kidney Disease
Learners experiment to determine information about kidney function. In this kidney function lesson, students use the scientific method to experiment with eggs, water, salt, sugar, and vegetable oil to simulate kidney function. They...
Curated OER
Go Car, Go!
Students design and build their own car. In this physics lesson, students collect data to determine the speed of the car. They plot the data on the graph analyze the relationship between variables.
Curated OER
Slingshot Characterization Experiment
Students set up and conduct a scientific experiment to demonstrate data collection. In this scientific process instructional activity, students complete an activity with the specific objective of using a slingshot to fire a t-shirt into...
Curated OER
The Lynx Eats The Hare
Students investigate the predator and prey relationship. This is done using a simple simulation. The simulation is done as an arts and craft activity. Students record data and track it using a graphic organizer and then they discuss the...
Curated OER
Let's Gather Around the Circle
Scholars explore the relationship between circumference and diameter. Groups of learners measure the diameter and circumference of round objects and record their data on a given worksheet. They then input the data into their graphing...
Curated OER
Air Pressure & Barometers
Fourth graders observe, measure, and record data on the basic elements of weather over a period of time (i.e., precipitation, air temperature, wind speed and direction, and air pressure). Then, they make a barometer and keep record of...
Curated OER
Infusing Equity in the Classroom by Gender
Students investigate the idea of gender descrimination in the classroom. In this algebra lesson, students collect data in stereotyping, and gender bias in the classroom, school materials and activities. They graph and analyze their...
Discovery Education
Sonar & Echolocation
A well-designed, comprehensive, and attractive slide show supports direct instruction on how sonar and echolocation work. Contained within the slides are links to interactive websites and instructions for using apps on a mobile device to...
Science 4 Inquiry
Deforestation
Young scientists observe deforestation from satellite photos and discuss the importance of forests to the global environment. They then simulate a plot of forest when farmers move into the area over the course of seven years. Finally,...
Curated OER
Science: Lead Shot and Waterfowl
Students examine data to investigate the impact of lead shot pellets on waterfowl populations. They graph their findings and discover how lead in ingested by birds and poisons them. As an extension, students research legislation and...
Curated OER
Velocity of Traffic on Highway 26
Physics fanatics time five cars as they pass on the highway. They use the times and a 20-yard distance to calculate velocity. They also graph distance vs. time. A page of student pre-lab questions is provided in addition to the activity...
Curated OER
Settlement Exploration: Then and Now
NASA has crafted an imaginative and memorable series of lessons, "NASA and Jamestown Education Module." This instructional activity is one of the five components. In it, middle schoolers connect history and science by comparing the...
Curated OER
Water in the Geosphere
Through a PowerPoint presentation and the embedded animation and video, earth science enthusiasts find out about the moisture in the soil beneath our feet. In the animation, follow a water molecule on its path through the water cycle. As...
Curated OER
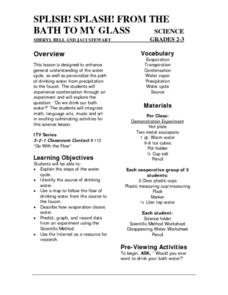
Splish! Splash! From the Bath to my Glass
An excellent lesson on the water cycle! In it, learners should gain a general understanding of the water cycle, along with how water first falls as precipitation, then ends up coming out of our faucets. This lesson nicely integrates...
Curated OER
Vectors: Follow That Arrow
Vectors and their connection to motion. A video will be presented to provide information for the class to use methods of solving vectors with and without grids. Real-world physical concepts will be explored in reference to vectors.
Curated OER
Graphing Data from the Chemistry Laboratory
Students graph and analyze data using a spreadsheet.
Curated OER
Problem-Solving Application: Use a Graph
In this problem solving worksheet, 6th graders use the problem solving steps of understand, plan, solve and look back to answer a graphing question.
Curated OER
Scientific Graphs
Students organize data collected from their experiments using graphs. For this statistics and biology lesson, students organize their scientific data from an article into readable graphs. They define the usefulness of their graph and...
Curated OER
Model Data with Quadratic Functions
Students model data using quadratic equations. In this algebra lesson, students simplify and factor quadratic equations. They graph the function using collected data and analyze the parabola.


