Curated OER
Heredity, Genetics, Traits
Eighth graders study how an embryo develops into a fetus by undergoing many physical changes which they observe on a poster. They examine the metamorphosis of fruit flies as they develop through a series of changes. They record the...
Curated OER
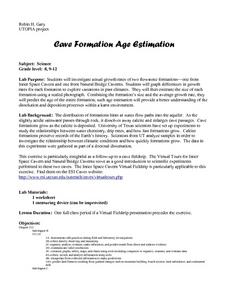
Cave Formation Age Estimation
Learners investigate growth rates of flowstone formations. They view a virtual field trip and discuss how flowstones form. They observe the cave fieldtrip and predict the growth rate for a cave formation. They graph growth rates and...
Curated OER
Hatching Chickens
Young scholars learn the importance of caring for eggs as they hatch chickens. In this egg hatching lesson, students observe what happens when eggs are hatched into chickens by completing a e-worksheet and watching a web based movie.
Curated OER
Perimeter Pattern
High schoolers investigate perimeter patterns formed by a hexagon and a triangle. They will identify the dependent and independent variable and write a function for the relationship.
Curated OER
Graph Both Crusts
Fourth graders calculate the angles and construct a pie graph of the percentages of the elements in the continental and oceanic crusts. Then they analyze the results. They can be assigned the task of researching the percentages.
Curated OER
Paper Parachutes
Students participate in a simulation of a parachute-jump competition by making paper parachutes and then dropping them towards a target on the floor. They measure the distance from the point where the paper parachute lands compared to...
Curated OER
Conductivity of salt Solutions
Students investigate the concentration level of solutions. For this math/science lesson, students identify three different ionic compounds. They predict the conductivity of each using their collected data.
Curated OER
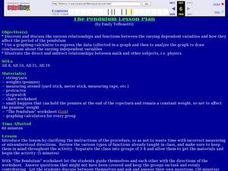
The Pendulum
Students discover and discuss relationships and functions between varying dependent variables and how they affect the period of the pendulum. They use graphing calculator to express the data collected in a graph, to analyze the graph,...
Curated OER
Crustal Sinking
Students measure the rate of sinking of a test tube into a beaker of "glop", representing a model of the interaction between the Earth's crust and upper mantle. This task assesses students' abilities to make simple observations,...
Curated OER
Rate of Solution
Eighth graders determine the amount of agitation necessary to dissolve various sized sugar particles. This task assess students' abilities to collect, organize, and interpret data, create appropriate graphs, predict future events based...
Curated OER
Weather v. Climate
Ninth graders discuss the differences between climate and weather as a class. Using data they collected, they create a graph of the data to share with the class over a specific time period. They compare and contrast this data with...
Curated OER
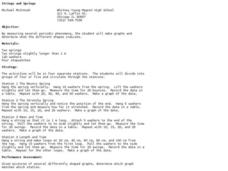
Strings and Springs
Ninth graders explore physics with springs and strings. In this force and motion lesson, 9th graders rotate through four stations exploring how various springs stretch and bounce, and how mass and length affect a pendulum's swing. They...
Curated OER
Journal of the Stars
Students receive balloons representing the "Life Cycle of the Stars." As the attached script is read, students follow the directions for the color of balloon they are given. Students chart the results for their star. They plot data from...
Curated OER
Family Vacation
Students use math to plan a trip by houseboat down the Mississippi River. They research and obtain information on the Mississippi River and its surroundings and use multiple graphs to represent their data.
Curated OER
Amazing Bean Races
Students experiment with bean growth in varied conditions. In this plant biology lesson, students plant beans in soil and in spun cellulose (absorbent material in diapers) and measure the growth of their seedlings. They collect the data...
Curated OER
Hot Rocks
Learners demonstrate that setting of plaster and cement is a change, which involves a release of heat energy, use data collected experimentally to construct comparison graphs and analyze the graphs to make predictions about future...
Curated OER
Trouble in the Troposphere
Students Use data sets from MY NASA DATA to produce graphs comparing monthly and yearly ozone averages of several U.S. cities. They analyze and evaluate the data and predict trends based on the data. In addition, they discuss and...
Curated OER
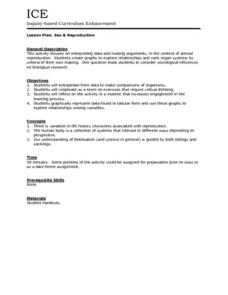
Sex & Reproduction
Students examine animal reproduction by interpreting data and making arguments and then create their own graphs to explore relationships of organ systems. This lesson plan includes an individual worksheet and a reflective review...
Curated OER
Fuel Mystery Dis-Solved
Learners describe how temperature and surface area exposure affect the rate at which fuel is consumed. They explain why engineers want to know about the properties of a fuel when designing rockets. They create a bar graph of result data.
Curated OER
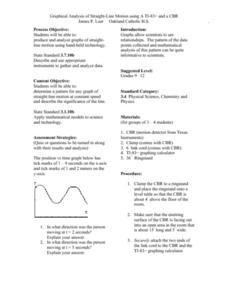
Graphical Analysis of Straight-Line Motion
Students investigate the concept of straight line motion. They determine the pattern and graph it looking for the motion maintained at a constant speed. Students also write a description of the significance of the line. The skill of...
Curated OER
Impact Craters and Water on Mars
Pupils explore for water on Mars using impact crater morphology. During this lab, students: investigate how to use the equation writing and graphing capabilities in Microsoft Excel, then develop and apply an impact crater depth-diameter...
Curated OER
The Swinging Pendulum
Students observe a pendulum and graph their observation. In this algebra lesson, students use the TI calcualtor to graph the motion the pendulum makes. They analyze the graph and make predictions.
Curated OER
Labeling the World
Sixth graders conduct research on the countries found on the labels on their clothing. They locate the countries on a map, research the labor practices on countries that export clothing to the U.S., and create a graph using the information.
Curated OER
Sled Kites and Trigonometry
Students study the history of kites and their fundamental properties. In this kites instructional activity students divide into teams and build and fly kites.


