Curated OER
Probability Using M & M's
Young scholars develop an understanding of probability by sorting bags of M & M's by color and recording the results in percents. The data is entered onto a spreasdsheet and graphed.
Curated OER
Asthma "Outbreak" Exercise
Students investigate numerical data on a possible asthma epidemic. Using statistical information, students graph and figure ratios of the epidemic. They evaluate the mortality rate from severe smog in the 1950's in London.
Curated OER
Dimming the Sun
Students collect, interpret and analyze weather variable data. They describe atmospheric variables that affect evaporation. Students create graphs and analyze the information collected.
Curated OER
It's Your Choice
Students compare data and determine the appropriate way to organize the data. They use physical graphs, pictographs, and symbolic graphs to display their data. In addition, they complete a Venn diagram.
Curated OER
Sea Surface Temperature Trends of the Gulf Stream
Students explore the importance of the Gulf Stream. Using a NASA satellite images, they examine the sea surface temperature. Students collect the temperature at various locations and times. Using spreadsheet technology, they graph the...
Curated OER
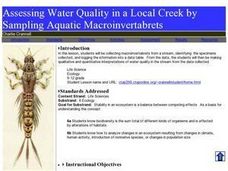
Assessing Water Quality in a Local Creek by Sampling Aquatic Macroinvertabrets
Learners experiment collecting macroinvertebrates from a stream and identify the specimens collected and then log in the information into a data table. From the data, they make qualitative and quantitative interpretations of water quality.
Curated OER
Are We Alone
Seventh graders collect/analyze data and draw conclusions; support reasoning by using a variety of evidence; construct logical arguments; access information at remote sites using telecommunications; apply the concept of percent;...
Curated OER
It Takes All Kinds!
Students view video clips and observe similarities and differences between animals. They sort animals into groups for a zoo. They make a graph of their observations and review scientific classifications.
Curated OER
Valentine Hearts
Students sort candy Valentine hearts into groups and create individual graphs.
Curated OER
Streamflow
Students discuss the topic of streamflow and how it occurs. They take measurements and analyze them. They interpret data and create their own charts and graphs.
Curated OER
Comparing Temperatures in Different Cities
Pupils generate a spreadsheet to calculate average daily temperature. They create graphs from spreadsheet data and comprehend the components of the a spreadsheet.
Curated OER
Parts of a Whole
Fourth graders explore fractions through the analysis of various paintings. They view and discuss paintings by Picasso and Seurat, discuss the fractional examples in the paintings, and create a bar graph.
Curated OER
Pumped Up Gas Prices
Students spend one month keeping track of the mileage and gasoline amounts they or their family has used. Information is entered into a spreadsheet to help calculate the average gas prices over time.
Curated OER
Sunspots and Climate
High schoolers make a graph that shows how the number of sunspots has changed over the past 30 years and discover how there is a pattern in sunspot number. They find a disruption in this pattern due to the Little Ice Age.
Curated OER
Texas Weather Report
Students use provided links to observe selected weather sites and collect temperature and precipitation data for listed cities. They enter the information onto their spreadsheet. Students study maps of the Texas natural reagions,...
Curated OER
Analysing 2001 Census Microdata
Eighth graders examine the census data of 2001. In this American History lesson, 8th graders analyze data using one- and two-variable statistical analysis. Students develop a research question that makes use of the microdata.
Curated OER
Rodeo Round-Up
First graders create a graph of the various teachers' favorite events at the rodeo.
Curated OER
Classification
Second graders sort insects into groups by determining similar characteristics. They role play as Entomologists to sort insects.
Curated OER
The Breathtaking Nature of the Urban Explosion, Part 2
High schoolers explore ozone levels. They measure the concentrations of ground-level ozone in the atmosphere. Students observe changes in the concentrations of ozone over time. High schoolers complete a data sheet to record ozone...
Curated OER
Memory/Physiology Lab Activity
Learners investigate the nervous system and how physical distractions influence mental performance. They work in pairs as a researcher and subject and memorize a series of words with no distractions. After repeating the list of words,...
Curated OER
Reduce and Reuse
Students conduct a lunch waste audit by recording each item they throw away at lunch. They graph class lunch waste. They use this information to devise a plan of action to reduce lunch waste. There is also an activity to make paper.
Texas Instruments
Say What You Mean!
Students analyze data and identify the mean. In this probability lesson, students log data in the TI and construct scatter plots from the data. They identify properties of a scatterplot.
Curated OER
Introduction to Worm Bin Project
Students observe the decomposing process of the food chain in a worm bin. They observe whether the type of food fed to worms affect the castings given off during the decomposition process. They learn and practice graphing their findings.
Curated OER
Weather "Whys" : Introduction to Weather
Students discuss weather forecasts and different types of weather. In this weather lesson, students observe the weather and learn a weather song. They listen to a story and see weather measurement tools.


