Curated OER
RIP M&M's
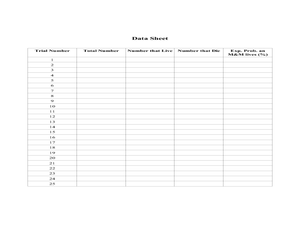
Students solve theoretical probability problems. In this algebra lesson, students apply the concept of probabilities to solving real life scenarios. They collect data and graph it using experimental probability.
Curated OER
Model and Solve Algebraic Equations
Examine multiple ways to solve algebraic equations. Pupils will generate a problem solving strategy that addresses the prompt given by the teacher. They will then share their problem solving strategy with the class. Graphic organizers,...
Curated OER
How Trees Contribute to the Water Cycle
In this water cycle instructional activity, 3rd graders conduct an experiment where they observe and calculate how water transpires in different types of trees. Students engage in a class discussion and use Venn Diagrams to compare...
Curated OER
Taking the Temperature
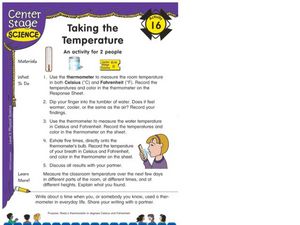
Students read a thermometer in Celsius and Fahrenheit. In this thermometer reading lesson, students take the temperature in different situations and discuss the results with a partner.
Curated OER
Billions of Bubbles
Students conduct an experiment with bubbles. In this observation and comparison lesson, students read Bubbles, Bubbles, Everywhere and conduct an experiment where they test different kinds of liquids to see which is the best for a...
Curated OER
Observing Properties of Matter
Third graders explore matter. In this physical science lesson, 3rd graders observe several items and use their five senses to describe their properties. Students record their observations and share with the class.
Curated OER
Raisin the Statistical Roof
Use a box of raisins to help introduce the concept of data analysis. Learners collect, analyze and display their data using a variety of methods. The included worksheet takes them through a step-by-step analysis process and graphing.
Curated OER
Play It
There are a number of activities here that look at representing data in different ways. One activity, has young data analysts conduct a class survey regarding a new radio station, summarize a data set, and use central tendencies to...
Curated OER
Tides at the Battery, NY
Skill in using Excel and increasing proficiency in manipulating data are challenged with this data analysis work. A web link supplies data and step-by-step instructions help learners create a graph. There are many extension activities...
Shodor Education Foundation
Graphing and the Coordinate Plane
Ready to introduce your class to the coordinate plane? This website includes a detailed lesson plan that includes two interactive games to help learners practice graphing ordered pairs. The scripted discussion is a little cheesy and a...
Curated OER
Coming to Know F and C
Students collect temperatures using a probe and examine data. In this temperature lesson students complete an activity using a graphing calculator.
Curated OER
Fire Wars
Your class can practice collecting and analyzing data. They extrapolate information and derive data from fire season statistics. They also choose the most appropriate format to display collected data.
Curated OER
Funerals and Burial Rites
Ninth graders research burial practices that originated in West Africa and then migrated to the South Carolina and Ohio. They compare and contrast burial practices in both places. As students collect information and data, they organize...
Curated OER
Survey and Share
Students practice collecting data by surveying other students. In this data collection lesson plan, students decide on a question and collects data from 15 other students. Eventually the students will end up graphing their results.
Curated OER
Icebergs: Relationship of Ice to Water
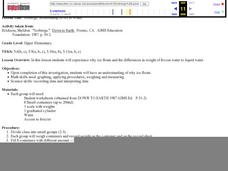
Students experience why ice floats and the differences in weight of frozen water to liquid water. Students explore why ice floats. They use math skills such as: graphing, applying procedures, weighing and measuring. Students also use...
Curated OER
Predicting Monthly Precipitation
Students should log onto, and collect data from, a specific site on the Internet. They average and compare the data using the Excel spreadsheet program, make predictions from their data, and determine the percent error of their predictions.
Curated OER
Observing Fall Migrants
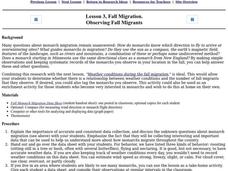
Students keep a detailed data collection log of the different types of monarch behavior. They track the weather conditions daily and link it to the migration of the monarchs. They summarize their data using either a graph or a computer...
Curated OER
Shaquille O'Neal Hand & Foot Span
If Shaquille O'Neal wears a size-20 shoe, how big are his hands? Learners will use the average ratios of foot length to hand span to calculate the hand span of Shaq, but first, they have to collect the data! They will measure their peers...
Cornell University
Non-Newtonian Fluids—How Slow Can You Go?
Children enjoy playing with silly putty, but it provides more than just fun. Young scientists make their own silly putty using different recipes. After a bit of fun, they test and graph the viscosity of each.
Curated OER
How Long Can You Go?
Eighth graders examine the usefulness of a line of best fit by collecting and graphing data, using a graphing calculator to determine the line of best fit, and making a variety of predictions. They watch a video, then design a...
Curated OER
How Many Letters Are In Your Name?
Students discover how to make a graph that represents the number of letters in their names. In this early childhood math lesson plan, students collect data, categorize data, and develop skills to analyze the pieces of data.
Polar Trec
Ozone Data Comparison over the South Pole
Did you know the hole in the ozone is seasonal and filled by January every year? The lesson uses scientific measurements of the ozone over the South Pole to understand patterns. Scholars learn that the hole grew bigger annually before...
Willow Tree
Histograms and Venn Diagrams
There are many different options for graphing data, which can be overwhelming even for experienced mathematcians. This time, the focus is on histograms and Venn diagrams that highlight the frequency of a range of data and overlap of...
Curated OER
A Research Project and Article For the Natural Inquirer
Get your class to use the scientific process to solve a scientific problem. They utilize the Natural Inquirer magazine to identify a research question which they write an introduction to and collect data to answer. They use graphs,...


