Curated OER
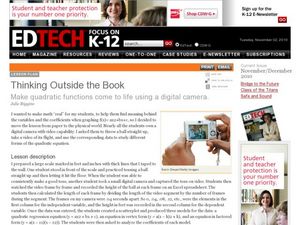
Thinking Outside the Box
Now this lesson sounds fun! Learners throw a ball, film it as it soars through the air, and use a spreadsheet to collect data. A scatterplot is created to produce a quadratic regression equation, an equation in vertex form, and an...
Howard Hughes Medical Institute
Color Variation over Time in Rock Pocket Mouse Populations
A species-specific look at natural selection, the resource herein examines how adaptations have helped the population of rock pocket mice survive in a changing landscape. To begin, middle or high schoolers watch a 10.5 minute video,...
Creative Learning Exchange
The Infection Game: The Shape of Change
Encourage the spread of knowledge in your class with this cross-curricular epidemic simulation. Pulling together science, social studies, and math, this lesson engages students in modeling the spread of infectious diseases, collecting...
Virginia Department of Education
A-Mazing Plants
Have your young scientists questioned why plants grow a particular way? Through this learning opportunity, scientists gain firsthand knowledge about how plants develop and various factors that affect rates of growth as they bring plants...
Curated OER
Who's got the fastest legs?
Students use a stopwatch to collect information for a scatterplot. In this fastest legs lessons, students collect data through the taking of measurements, create and find a median number. Students develop an equation and answer...
Nuffield Foundation
Measuring the Rate of Metabolism
Plant respiration can be a difficult concept for young biologists to grasp; with a hands-on lab, learners can collect and graph data, then calculate the metabolism rate for the plants they studied. If you do not have a respirometer,...
American Chemical Society
Different Substances React Differently
Looks don't tell the whole story. Young experimenters explore reactions with substances that look similar. They observe the reactions that take place when combined with baking soda and use indicators to conclude they react differently...
Curated OER
Graphing Favorite Fruit
Third graders take poll and sort data, enter the data to create a spreadsheet and create bar and pie graphs.
Curated OER
Asthma Survey
Learners collect survey data on the prevalence of asthma in a community. They summarize and display the survey data in ways that show meaning.
Curated OER
Is Global Warming Happening?
Students investigate the probability of global warming and the effects of global warming on the environment. They conduct Internet research and collect data, transfer the data onto an Excel spreadsheet, and create a presentation that...
Curated OER
Take an Ant to Lunch
Second graders construct a model of an ant, exemplifying that ants are insects. Students gather data create a pictograph chart to show ant food preferences. Also, 2nd graders access the Internet to explore ant eating habits.
Curated OER
A Plop and Fizz
Seventh graders perform an experiment to determine the effect of temperature on reaction rates. In this chemistry lesson, 7th graders take measurements and record data. They create a graph and analyze results.
Curated OER
The Stoichiometry Behind Pollution
Students research car emissions of various cars and find the toxins emitted. In this stoichiometry lesson, students calculate the relationship between reactants and products in a chemical reaction. Students collect data on emissions and...
Science 4 Inquiry
Journey Through the Spheres of the Earth
Each of the Earth's spheres interacts with the other spheres in predictable ways. Young scientists explore these interactions through a hands-on activity, graphing, and watching a video. They summarize their knowledge in a video or...
University of Georgia
Energy Content of Foods
Why do athletes load up on carbohydrates the evening before a competition? The lesson helps answer this question as it relates the type of food to the amount of energy it contains. After a discussion, scholars perform an experiment to...
Curated OER
Scatter-Brained
Seventh graders graph ordered pairs on a coordinate plane. They create a scatterplot. Additionally, they determine the line of best fit and investigate the slope of the line. Multiple resources are provided. An excellent resource!
Science 4 Inquiry
Deforestation
Young scientists observe deforestation from satellite photos and discuss the importance of forests to the global environment. They then simulate a plot of forest when farmers move into the area over the course of seven years. Finally,...
Foundation for Water & Energy Education
How is Flowing Water an Energy Source? Activity A
Here is a fun little exploration of the potential energy potential of falling water. Learners drop water from various heights using a straw, and they analyze the diameter of the splash. Pair this with two more activities of the same...
Curated OER
Get a Leg Up
Traveling through space is an amazing experience, but it definitely takes a toll on the body. After reading an article and watching a brief video, learners perform an experiment that simulates the effects of zero gravity on the human body.
Curated OER
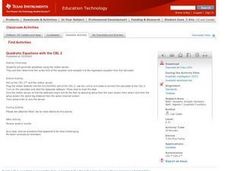
Quadratic Equations with the CBL 2
Learners practice generating parabolas with a motion sensor while determining the vertex form of the equation. They compare it to the regression equation from the calculator onto a data mate software. Each student completes several...
Curated OER
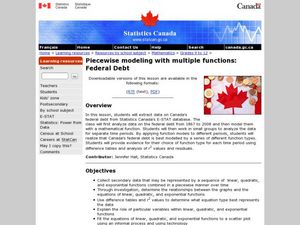
Piecewise Modeling with Multiple Functions: Federal Debt
Students analyze data on debt and write an equation. In this statistics lesson, students are given data from different time periods, and are asked to graph and analyze the data. They work in groups, and are assigned different parts of...
Curated OER
Epidemiology: Graphing and Analyzing Health Data
Students graph data on fetal and infant mortality rates collected by the Centers for Disease Control and Prevention. They identify trends in the data and propose potential causes for the trends.
Curated OER
Smoking: The Real Cost
Third graders discuss the adverse effects of smoking and predict the financial cost of a smoking habit. They collect data regarding the cost of a pack of cigarettes and average packs smoked a day. They create bar graphs displaying the...
Curated OER
Graphs Galore
Fourth graders conduct surveys to collect data. They analyze and interpret the data, then determine which type of graph is appropriate for the data. Students use the data to make predictions, discover patterns and draw conclusions...


