Math Graphs
Houghton Mifflin: Math Graphs: Line of Best Fit 16 [Pdf]
The practice problem explores the validity of the line of best fit and a linear regression model created on a graphing calculator. The given points are available in PDF format.
Math Graphs
Houghton Mifflin: Math Graphs: Line of Best Fit 17 [Pdf]
Students calculate a linear regression model using a graphing calculator. The given points are available in PDF format.
Math Graphs
Houghton Mifflin: Math Graphs: Line of Best Fit 18 [Pdf]
Students calculate a linear regression model using a graphing calculator. The given points are available in PDF format.
Missouri State University
Missouri State U.: Multivariate Statistics: Concepts, Models, and Applications
This site features an online textbook with very in-depth information about multivariable statistics. (NOTE: In the archived version, some images do not appear. However, many of them are multiple-choice questions for students, and if you...
ClassFlow
Class Flow: Fitting Models to Data
[Free Registration/Login Required] A basic premise of science is that much of the physical world can be described mathematically and many physical phenomena are predictable. This scientific outlook took place in Europe during the late...
Texas Instruments
Texas Instruments: Ball Bounce
This activity allows students to use real data obtained by them to model quadratic equations. students can use the TI-83 and/or TI-84 and a motion detector to collect their data. The students will then manually fit both quadratic and...
Illustrative Mathematics
Illustrative Mathematics: S Id.7 Used Subaru Foresters
Jane wants to sell her Subaru Forester and does research online to find other cars for sale in her area. She examines the scatterplot of price versus age and determines that a linear model is appropriate. Answer a variety of questions...
Math Graphs
Houghton Mifflin: Math Graphs: Line of Best Fit 13 [Pdf]
Students investigate the line of best fit and the regression feature of a graphing calculator. The example consists of a math graph with given points that are available in PDF format.
Math Graphs
Houghton Mifflin: Math Graphs: Line of Best Fit 14 [Pdf]
Students investigate the line of best fit and the regression feature of a graphing calculator. The example consists of a math graph with given points that are available in PDF format.
Math Graphs
Houghton Mifflin: Math Graphs: Line of Best Fit 9 [Pdf]
The practice problem has learners sketch a line of best fit, create a linear model, and compare both lines on a calculator. The given points are available in PDF format.
Math Graphs
Houghton Mifflin: Math Graphs: Line of Best Fit 10 [Pdf]
The practice problem has learners sketch a line of best fit, create a linear model, and compare both lines on a calculator. The given points are available in PDF format.
Math Graphs
Houghton Mifflin: Math Graphs: Line of Best Fit 11 [Pdf]
Students sketch a line of best fit, create a linear model, and compare both lines on a calculator. The given points are available in PDF format.
Math Graphs
Houghton Mifflin: Math Graphs: Line of Best Fit 12 [Pdf]
Students sketch a line of best fit, create a linear model, and compare both lines on a calculator. The given points are available in PDF format.
Texas Instruments
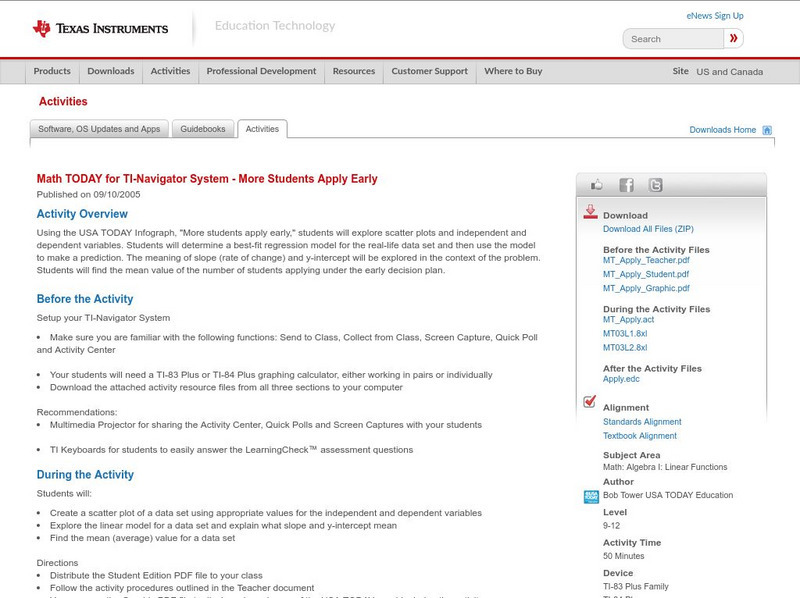
Texas Instruments: Math Today for Ti Navigator System: More Students Apply Early
Using the USA TODAY Infograph, "More students apply early," students will explore scatter plots and independent and dependent variables. Students will determine a best-fit regression model for the real-life data set and then use the...
Texas Instruments
Texas Instruments: What Is a Kanban?
In this activity, students use the CellSheet Application to understand how to track inventory and predict future trends based on average daily use. They will collect data, analyze it and make predictions. They also learn to use linear...
Massachusetts Institute of Technology
Mit: Open Course Ware: Introduction to Probability and Statistics
The online course consists of educational materials about probability and statistics. Lecture notes, exams, and assignments are included.
Texas Instruments
Texas Instruments: The Calcumites Are Coming! Ti 83
Students model the growth of a population and compare ideal growth with a population whose growth is limited. They use technology to find exponential and logistic regression equations and use them to plot models.
McGraw Hill
Glencoe Mathematics: Online Study Tools: Self Check Quiz on Linear Functions
The online assessment demonstrates knowledge of advanced mathematical concepts in Algebra II. The questions test students on linear functions. Topics include modeling real-world data with linear functions, scatterplots, and regression...
Texas Instruments
Texas Instruments: Forecasting
Students use regression to forecast values from a data. They study exponential smoothing. They also use the program FORECAST to automate a multiplicative model.
Texas Instruments
Texas Instruments: Fitting an Equation to Bivariate Data
In this activity, students fit a linear least-square regression line to population data. They explore various functions to model the given data.
Texas Instruments
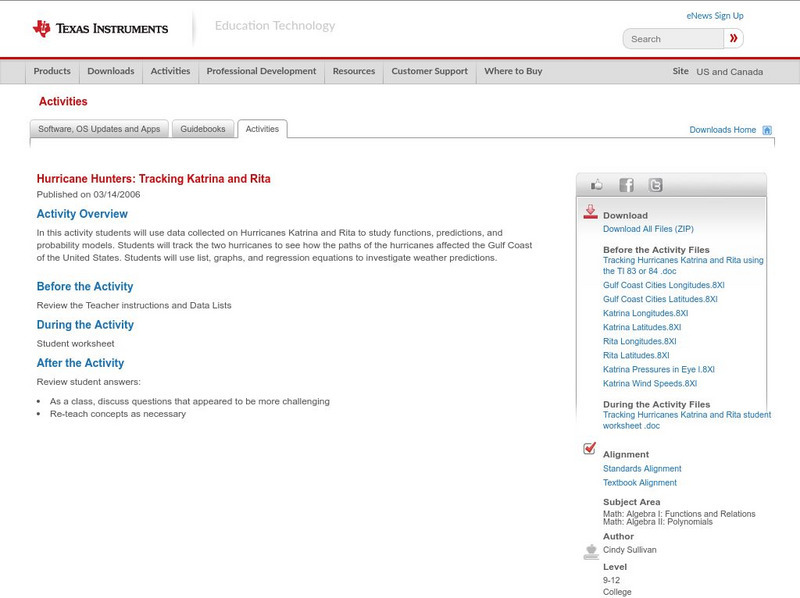
Texas Instruments: Hurricane Hunters: Tracking Katrina and Rita
In this activity students can use data collected on Hurricanes Katrina and Rita to study functions, predictions, and probability models. Students will track the two hurricanes to see how the paths of the hurricanes affected the Gulf...
Texas Instruments
Texas Instruments: Burning Volumes
An analysis of how the volume of various jars impacts the burning time of candles. Data collected will be used to explore modeling, line fitting and linear regression Using graphing calculators.
Texas Instruments
Texas Instruments: Women's 5000 M World Record Progression: Median Median Line
In this activity, students will collect the Women's 5000 meter progression of world record data and find the median - median line and the linear regression for the data. They will investigate the appropriateness of each of the models.
Other
Stat Soft: Statistics Glossary
Dozens of statistical terms are defined and illustrated in this glossary.


![Houghton Mifflin: Math Graphs: Line of Best Fit 16 [Pdf] Unknown Type Houghton Mifflin: Math Graphs: Line of Best Fit 16 [Pdf] Unknown Type](https://d15y2dacu3jp90.cloudfront.net/images/attachment_defaults/resource/large/FPO-knovation.png)


