Curated OER
Classification/Taxonomy/Statistics Review
"Does King Phillip Cry Over Flimsy Grass Stems?" You might not answer that question with this exhaustive worksheet, but your biology class will get the full scoop on the hierarchy of biological classification with this resource. It...
Curated OER
Introduce: Cause and Effect
Introduce beginning readers to cause and effect in a story by exploring it together. Learners make predictions about a book based on its cover, title, and a brief flip through the pages. They listen to an explanation of cause and effect...
CK-12 Foundation
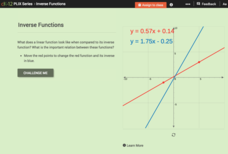
Inverse Functions
Provide a graphical view of inverses. Pupils manipulate points on a line and see the relationship of the graph with the graph of its inverse. Using the relationship between the graphs, scholars respond to questions concerning inverses...
Curated OER
Proportions
In this proportions activity, students solve and complete 7 various types of problems. First, they determine the better buy based on the information provided for each word problem. Then, students find the value of a variable given its...
Curated OER
Beach Poetry
Familiarize young analysts with the relationship between words, meaning, and visual images. They consider the relationship between the painting Beach Poetry and the poem Sandpaper. They compose and illustrate an original a beach poem...
Curated OER
Writing Exercises: Imperialism I
Examine the impact of Imperialism in relation to power and industrialization. There are three short answer questions for critical thinkers to respond to in this handout. They'll describe the relationship between Imperialism and...
American Statistical Association
You and Michael
Investigate the relationship between height and arm span. Young statisticians measure the heights and arm spans of each class member and create a scatter plot using the data. They draw a line of best fit and use its slope to explain the...
Japan Society
Nature and the Environment in Postwar Japan
Japan has a complex relationship with the environment. Explore this relationship with your class through this resource. Included are thought questions, several activity ideas that range from writing, to discussion, to research, and an...
Illustrative Mathematics
Coffee by the Pound
This is a great exercise in graphing proportional quantities to interpret the unit rate as the slope of a graph. It is not easy for learners to understand what a unit rate is. When it is presented as the slope of a linear line graph,...
Illustrative Mathematics
The Escalator, Assessment Variation
A great way to practice with unit rates, the activity gives your mathematicians an opportunity to compare different statements and select which are true. They can practice with "choose all that apply" by setting each statement into its...
Illustrative Mathematics
Two-School Dance
Who's ready for the dance? When two middle schools combine for a dance, your learners' job is to calculate the ratio of girls attending. Provided with three different solutions, you can choose from setting up a ratio, linear equation, or...
EngageNY
Similarity and the Angle Bisector Theorem
Identifying and verifying reproducible patterns in mathematics is an essential skill. Mathematicians identify the relationship of sides when an angle is bisected in a triangle. Once the pupils determine the relationship, they prove it to...
EngageNY
Graphing Cubic, Square Root, and Cube Root Functions
Is there a relationship between powers and roots? Here is a activity that asks individuals to examine the graphical relationship. Pupils create a table of values and then graph a square root and quadratic equation. They repeat the...
Balanced Assessment
Ostrich and Seahorse
Examine the relationship between ratios and scale. Young math scholars compare ratios of two models. They use the ratios to make a comparison between the two models. Each image uses a different scale, which requires learners to think...
Balanced Assessment
Toilet Graph
Mathematics can model just about anything—so why not simulate the height of water in a toilet bowl? The lesson asks pupils to create a graphical model to describe the relationship of the height of the water as it empties and fills again....
Virginia Department of Education
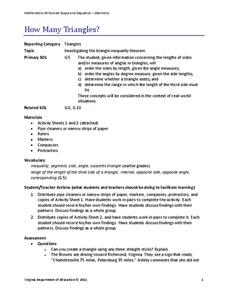
How Many Triangles?
Something for young mathematicians to remember: the sum of any two sides must be greater than the third. Class members investigates the Triangle Inequality Theorem to find the relationship between the sides of a triangle. At the same...
CK-12 Foundation
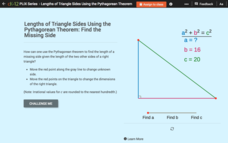
Lengths of Triangle Sides Using the Pythagorean Theorem: Find the Missing Side
What is the relationship between the sides of a right triangle? Learners use an interactive to create models of right triangles and view the relationship between the lengths of the sides. They finish by using the Pythagorean Theorem to...
EngageNY
Writing and Evaluating Expressions—Exponents
Bring your young mathematicians into the fold. Scholars conduct an activity folding paper to see the relationship between the number of folds and the number of resulting layers in the 23rd installment of a 36-part module. The results of...
CK-12 Foundation
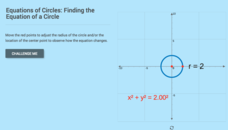
Equations of Circles: Finding the Equation of a Circle
It's all about location and size. With the aid of the interactive, pupils explore the relationship between the location and size of a circle and its equation. The learners use that relationship to determine the equation of a circle given...
EngageNY
Grade 10 ELA Module 4: Unit 2, Lesson 4
Ambition, murder, nontraditional gender roles ... some problems just can't be fixed in marriage counseling. Learners discuss the relationship between Macbeth and Lady Macbeth. As a culminating activity, pupils analyze how the characters'...
Radford University
2 and 3 Dimensional Shapes
Take a similar approach to three dimensions. Pupils develop the relationship between areas of similar objects and see how they relate to the ratio of the sides. Building upon area formulas, small groups put together volume formulas for...
EngageNY
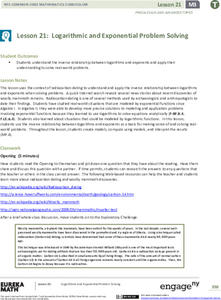
Logarithmic and Exponential Problem Solving
Just how old is it? The 22nd portion to a 23-part Precalculus unit uses radiocarbon dating and other exponential modeled real-world problems. Learners use the inverse relationship between logarithms and exponentials to solve the problem...
EngageNY
Close Read: Epiphytes of the Rainforest and the Creatures That Call Them Home (Pages 24–26)
It's all connected. Scholars use pages 24-26 of The Most Beautiful Roof in the World to identify the relationship between the plants and animals in the rainforest. They answer and discuss questions about the relationship with a group....
Flipped Math
Linear vs. Exponential
Linear or exponential?. Learners watch an informative video comparing situations that may be modeled by either a linear or exponential relationship. Pupils determine the type of relationship and then create a function that models the...
Other popular searches
- Healthy Relationships
- Relationships
- Interpersonal Relationships
- Linear Relationships
- Exponential Relationship
- Quadratic Relationships
- Ecological Relationships
- Family Relationships
- Symbiotic Relationships
- Inverse Relationship
- Angle Relationships
- Letter Sound Relationship


