Curated OER
Poetic Math Greeting Cards
Fourth graders work in groups; collect data in a survey; depict in tables, charts, or graphs the results of the survey; and make predictions. They use creative writing skills and computer skills to generate a greeting card of their own.
Curated OER
Sensational Soil
Fourth and fifth graders explore soil by taking a simulated field trip under the earth. They go to an Internet site that runs a simulation which charges them with finding a source of pollution that could destroy all of Earth's soil, and...
Curated OER
Jews in America at the Time of Growth and Change: Forging New Frontiers
Tenth graders examine the role of Jewish Americans in the 1900s. They examing the changes in industry and inventions. They also identify how Jewish Americans changed society and religious organization.
Granite School District
7th Grade CCSS Math Vocabulary Word List
Address key vocabulary in the seventh grade Common Core Math Standards with this comprehensive list. A series of word cards is also provided that supports each term with images and examples, making this an excellent tool for teaching the...
American Statistical Association
Happy Birthday to . . . Two?
How many people do you need in a room before two likely share the same birthday? Scholars consider this puzzle by analyzing a set of data. They ponder how to divide the data and determine the proper size of a group for this event to...
American Statistical Association
Exploring Geometric Probabilities with Buffon’s Coin Problem
Scholars create and perform experiments attempting to answer Buffon's Coin problem. They discover the relationships between geometry and probability, empirical and theoretical probabilities, and area of a circle and square.
American Statistical Association
Chocolicious
To understand how biased data is misleading, learners analyze survey data and graphical representations. They use that information to design their own plans to collect information on consumer thoughts about Chocolicious cereal.
Statistics Education Web
Text Messaging is Time Consuming! What Gives?
The more you text, the less you study. Have classes test this hypothesis or another question related to text messages. Using real data, learners use technology to create a scatter plot and calculate a regression line. They create a dot...
Curated OER
Questioning NASA
Space science and math collide in this inquiry that investigates launching times for antacid-tablet rockets! Upper elementary or middle school learners collect data as they launch these mini rockets. They apply concepts of place value...
Curated OER
Environmental Awareness and Children's Literature
Use an alternative setting for pregnant teens and young mothers, as well as special education children to examine environmental topics through literature. Included in this unit is a visit to neighborhood libraries to select children's...
Curated OER
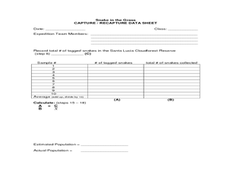
Snake in the Grass: Capture/Recapture Activity
Learners estimate the total number of species in Ecuador using the capture/recapture method. They collect data about each species and act as members of a science expedition to determine the total number of species by using mathematical...
Curated OER
Data Analysis Challenge
In this data analysis worksheet, young scholars work with a partner to collect information for a survey. The information is then compiled into a graph. Students must indicate their survey question, the target audience, predict the...
Curated OER
More Basic Biotechnology Tools, Sorting & Copying DNA
You can use these slides to explain the many complicated steps of the Polymerase chain reaction. The diagnostic and forensic uses of gel electrophoresis are detailed. This PowerPoint could be used to communicate facts, and also to prompt...
Curated OER
Graph It!
There is more than one way to represent data! Learners explore ways to represent data. They examine stacked graphs, histograms, and line plots. They conduct surveys and use stacked graphs, histograms, or line plots to chart the data they...
Statistics Education Web
Consuming Cola
Caffeine affects your heart rate — or does it? Learners study experimental design while conducting their own experiment. They collect heart rate data after drinking a caffeinated beverage, create a box plot, and draw conclusions. They...
Curated OER
Reference Materials
After a class discussion where kids share how they find answers to their questions, learners explore the world of reference materials such as, an atlas, an almanac, and an encyclopedia. The Internet is also discussed as a way to access...
Curated OER
Modeling: Having Kittens
Cats can't add, but they do multiply! Determine the number of descendants of a single cat given specific facts about cats and kittens. The lesson focuses on developing strategies for problem solving using both individual and group work....
American Statistical Association
Bubble Trouble!
Which fluids make the best bubbles? Pupils experiment with multiple fluids to determine which allows for the largest bubbles before popping. They gather data, analyze it in multiple ways, and answer analysis questions proving they...
Curated OER
Don't Let the Earth Down
Writing a persuasive argument starts with a clear thesis. Using this resource, your class will write a persuasive paper on a conservation issue. They will then transform their argument into a 30-second public service announcement. If...
Curated OER
Don't Let the Earth Down
Although recycling is definitely beneficial, reducing our waste and conserving our natural resources should really be the focus of environmentalists. Encourage the future generation to create a public service announcement about a...
Curated OER
A Collage of Canada
Students explore geography and culture of Canada. They play game that involves reviewing materials and answering questions about Canada, and create posters and brochures about life in Canada.
Curated OER
Writer's Workshop-Making it work
Sixth graders write multiple pieces and create a writing portfolio each marking period. In this writing lesson, 6th graders spend several weeks developing each piece of writing, conference with their parents at home, and decide which...
Curated OER
Using Bar Graphs to Understand Voting Patterns
Bar graphs are used as a way to study voting patterns in the United States. A variety of statistical data is presented in the graphs, and pupils must interpret the data in order to make a report to the class. Three excellent graphs,...
Curated OER
Any Day Can Be Earth Day
You can make the spirit of Earth Day last year round with these long-term projects.
Other popular searches
- Random Sampling Population
- Population Sampling
- Population Sampling Quadrat
- Population Sampling Qua Drat
- Population Sampling Quiz
- Bat Population Sampling
- Natural Population Sampling
- Population Sampling Marine
- Science Sampling Population


